. 2017 Aug 7;42(3):286-300.e4.
doi: 10.1016/j.devcel.2017.07.010.

Primary Cilia Signaling Shapes the Development of Interneuronal Connectivity

Affiliations

Primary Cilia Signaling Shapes the Development of Interneuronal Connectivity

Jiami Guo et al. Dev Cell. .

Abstract

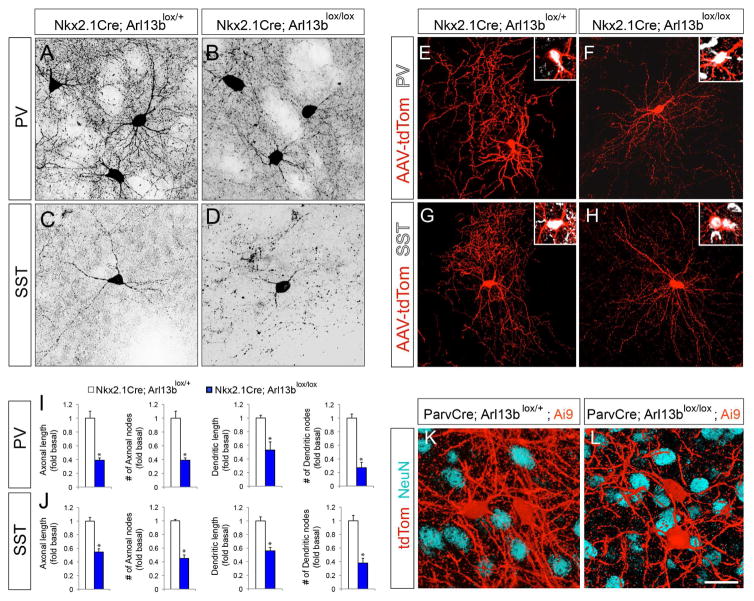
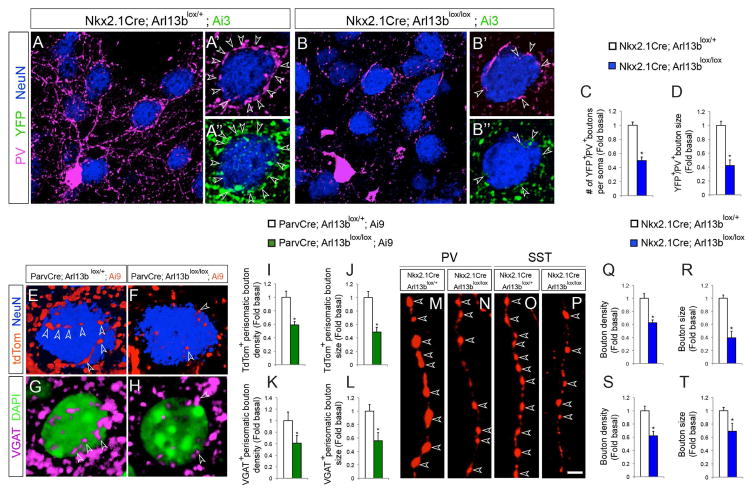
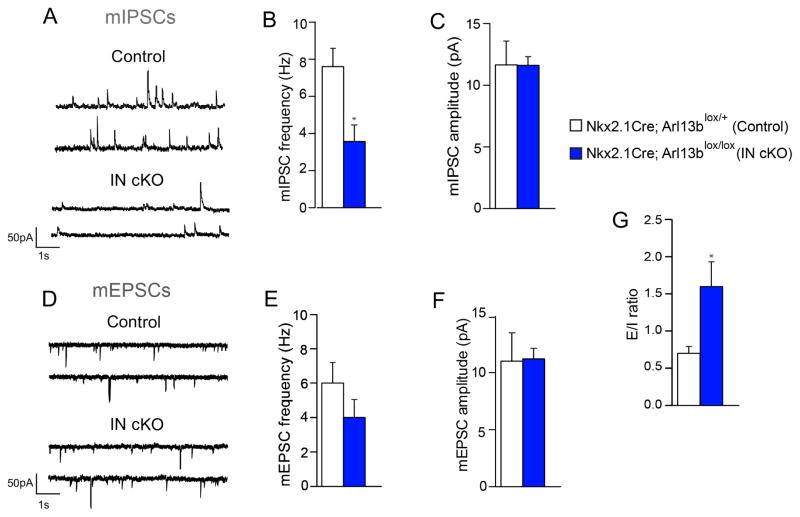
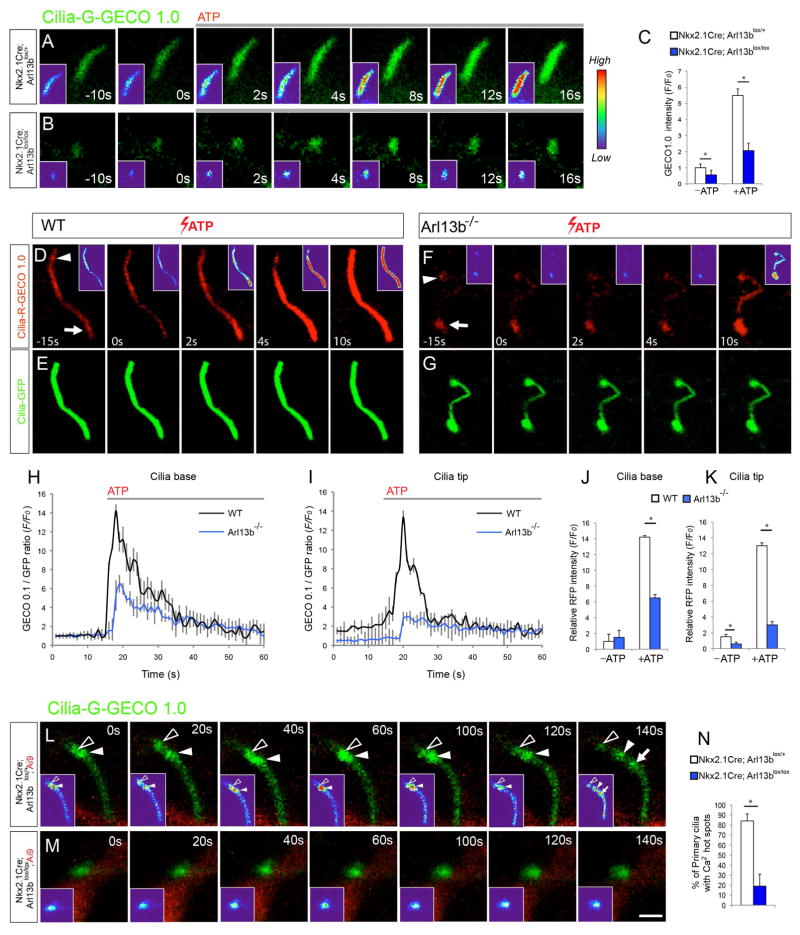
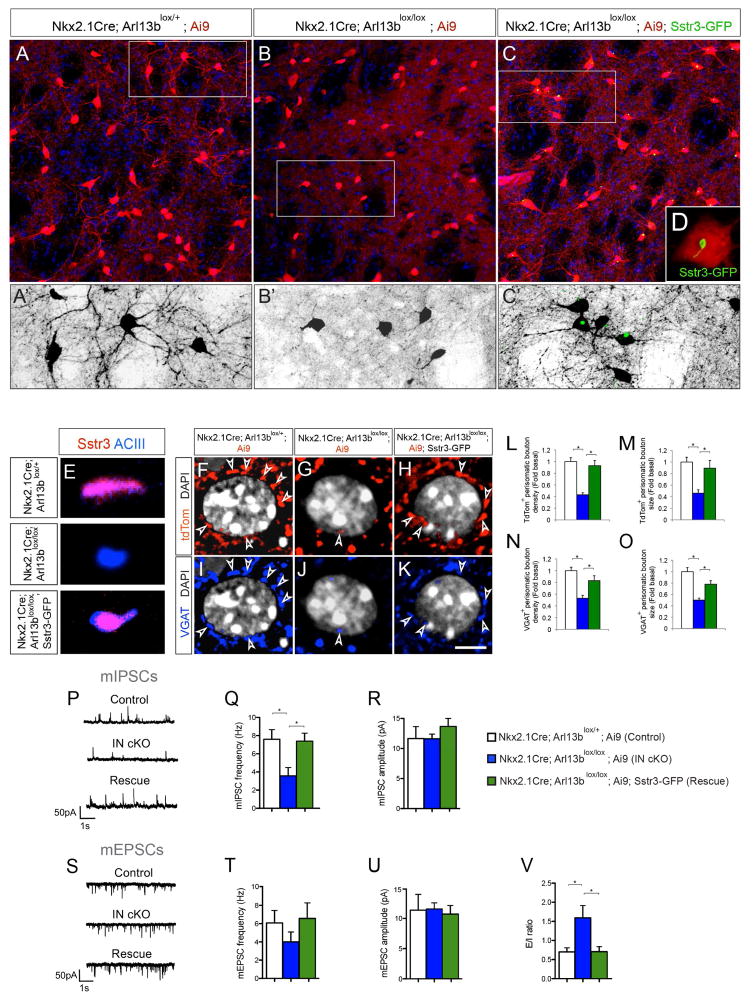
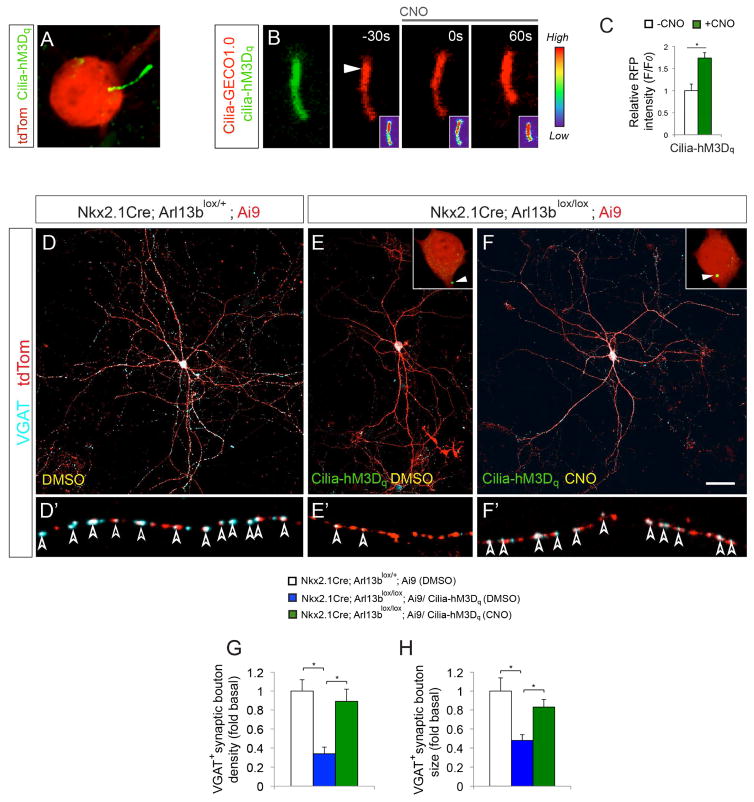
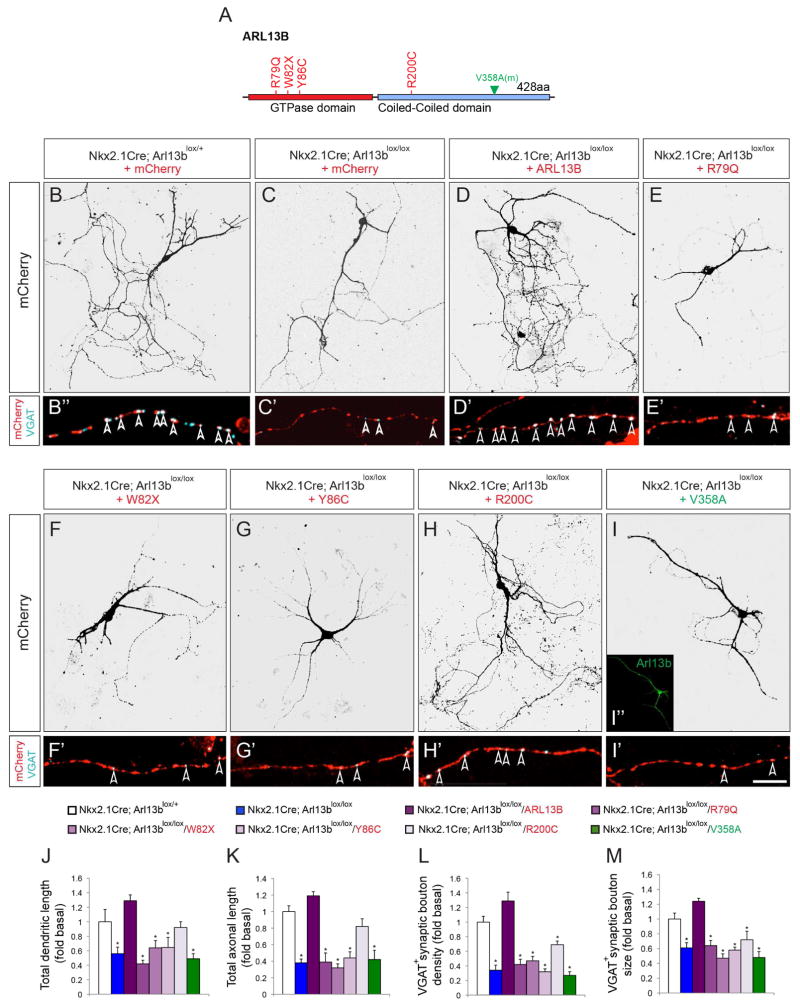
Appropriate growth and synaptic integration of GABAergic inhibitory interneurons are essential for functional neural circuits in the brain. Here, we demonstrate that disruption of primary cilia function following the selective loss of ciliary GTPase Arl13b in interneurons impairs interneuronal morphology and synaptic connectivity, leading to altered excitatory/inhibitory activity balance. The altered morphology and connectivity of cilia mutant interneurons and the functional deficits are rescued by either chemogenetic activation of ciliary G-protein-coupled receptor (GPCR) signaling or the selective induction of Sstr3, a ciliary GPCR, in Arl13b-deficient cilia. Our results thus define a specific requirement for primary cilia-mediated GPCR signaling in interneuronal connectivity and inhibitory circuit formation.

Keywords: Arl13b; GPCR signaling; Joubert syndrome related disorders; autism spectrum disorders; ciliopathies; circuitry; interneurons; primary cilia.


Figures

Figure 1
Figure 1. Deletion of Arl13b in interneurons results in morphological defects
(A–B) Striatal PV+ interneurons were labeled with anti-PV antibodies in Nkx2.1Cre; Arl13blox/+ (A) and Nkx2.1Cre; Arl13blox/lox (B) brains. (C, D) Striatal SST+ INs were labeled with anti-SST antibody in Nkx2.1Cre; Arl13blox/+ (C) and Nkx2.1 Cre; Arl13blox/lox (D) brains. (E–H) Representative images of PV+ (E, F) or SST+ INs (G, H) interneurons from AAV2-FLEX-tdTomato injected Nkx2.1Cre; Arl13blox/+ (E, G) and Nkx2.1Cre; Arl13blox/lox (F, H) brains. Insets (E–H) show co-labeling of tdTom+ neurons with PV (E, F) and SST (G, H) antibodies. (I–J) Quantification of morphological defects of PV+ (I) and SST+ (J) INs in Nkx2.1Cre; Arl13blox/lox brains [P30]. Data shown are mean ± SEM. *P<0.05 (Student’s t-test;). (K–L) Representative images of tdTom+ INs from ParvCre; Arl13blox/+; Ai9 (K) and ParvCre; Arl13blox/lox; Ai9 (L) brains [P60]. Neurons were co-labeled with anti-NeuN antibodies. Data shown are mean ± SEM. *P<0.05 (Student’s t-test, p[PV+ axonal length] = 5.32281E-06, p[PV+ axonal node] = 0.0005, p[PV+ dendritic length] = 0.0001, p[PV+ dendritic node] = 0.0003, p[SST+ axonal length] = 7.92531E-06, p[SST+ axonal node] = 0.0002, p[SST+ dendritic length] = 0.002, p[SST+ dendritic node] = 0.0003). 42 cells from 4 different brains were analyzed per group. Scale bar, 25μm (A–D); 50μm (E–H); 20μm (K, L). See also Figure S1, Figure S2, and Figure S3.
Figure 2
Figure 2. Changes in synaptic connectivity of Arl13b deficient interneurons
(A, B) Striatal neurons were labeled with anti-PV, anti-GFP, and anti-NeuN antibodies in Nkx2.1Cre; Arl13blox/+; Ai3 (A) and Nkx2.1Cre; Arl13blox/lox; Ai3 (B) brains. (A′, B′) PV+ or YFP+ perisomatic synaptic boutons (arrowheads) in control (A′, A″) and in Nkx2.1Cre; Arl13blox/lox (B′, B″) brains. Striatal medium spiny neurons (blue) are NeuN positive. (C, D) Quantification of PV+ perisomatic bouton density and size in control and Nkx2.1Cre; Arl13blox/lox; Ai3 brains [P30]. Data shown are mean ± SEM. *P<0.05 (Student’s t-test, p[C] = 0.0001, p[D] = 0.0001). (E–F) Representative images of striatal medium spiny neurons co-labeled with anti-NeuN antibodies in ParvCre; Arl13blox/+; Ai9 (E) and ParvCre; Arl13blox/lox; Ai9 (F) brains [P60]. Arrowheads indicate tdTom+ perisomatic boutons. (G, H) Representative images of striatal medium spiny neurons co-labeled with anti-VGAT antibodies and DAPI in ParvCre; Arl13blox/+; Ai9 (G) and ParvCre; Arl13blox/lox; Ai9 (H) brains. Arrowheads (G–H) indicate VGAT+ perisomatic boutons. (I–L) Quantification of PV+ perisomatic bouton density and size in control and ParvCre; Arl13blox/lox; Ai9 brains. Data shown are mean ± SEM. *P<0.05 (Student’s t-test, p[I] = 0.0001, p[J] = 0.0004, p[K] = 0.0003, p[L] = 0.0003). (M–P) tdTomato labeled PV+ (M, N) and SST+ (O, P) INs from AAV2-FLEX-tdTomato injected Nkx2.1Cre; Arl13blox/+ (M, O) and Nkx2.1Cre; Arl13blox/lox (N, P) brains show synaptic boutons (arrowheads) along single axons. (Q–T) Quantification of the synaptic bouton density and size of PV+ (Q, R) and SST+ (S, T) INs in Nkx2.1Cre; Arl13blox/lox brains. Data shown are mean ± SEM. *P<0.05 (Student’s t-test, p[Q] = 0.003, p[R] = 0.0004, p[S] = 0.0001, p[T] = 0.001). 42 cells from 4 different brains were analyzed per group. Scale bar, 8.5μm (A, B); 4.3μm (A′, A″, B′, B″); 2.5μm (E–H); 2μm (M–P). See also Figure S2 and Figure S3.
Figure 3
Figure 3. The functional impact of impaired primary cilia signaling in interneurons
(A) Representative patch-clamp electrophysiological recordings showing mIPSCs in striatal MSNs of Nkx2.1Cre; Arl13blox/+ (control) and Nkx2.1Cre; Arl13blox/lox (IN cKO) mice. (B, C) Quantification of mIPSC frequency (B) and amplitude (C). *P<0.05 (Student’s t-test, mIPSC frequency: t(15) = 3.167, p = 0.0066; control, n=6; IN cKO, n =11). (D) Representative recordings showing mEPSCs in striatal MSNs of Nkx2.1Cre; Arl13blox/+ and Nkx2.1Cre; Arl13blox/lox brains. (E, F) Quantification of mEPSC frequency (E) and amplitude (F). Data shown are mean ± SEM. (Student’s t-test; mIPSC amplitude, mEPSC frequency, mEPSC amplitude: t-values <1). (G) Overall excitatory/inhibitory ratio in striatal MSNs of Nkx2.1Cre; Arl13blox/+ and Nkx2.1Cre; Arl13blox/lox brains (Student’s t-test: t(14)=2.277; p = 0.0390; control, n=6; IN cKO, n=10).
Figure 4
Figure 4. Defective calcium signaling in Arl13b deficient primary cilia
(A–B) Time-lapse imaging of interneurons from Nkx2.1Cre; Arl13blox/+ (A) and Nkx2.1Cre; Arl13blox/lox (B) striatum expressing Cilia-G-GECO1.0. were treated with 10μM ATP. Insets (A–B) show changes in fluorescence intensity in pseudocolor (Red [High], Blue [Low]). (C) Quantification of changes in the fluorescence intensity of Cilia-G-GECO1.0 in control and mutant cilia. Data shown are mean ± SEM. *P<0.05 (Student’s t-test, p[−ATP] = 0.002, p[+ATP] = 0.0004). 15 neurons from 3 independent experiments were analyzed per group. (D–G) Time-lapse imaging of wild type (D, E) and Arl13b null (F, G) MEF cells expressing Cilia-R-GECO1.0 and Cilia-GFP treated with 10μM ATP. Arrowhead and arrow (D, F) indicate cilia tip and base, respectively. Insets (D, F) show fluorescence intensity in pseudocolor. (H, I) RFP fluorescence/GFP fluorescence ratio at cilia base (H) and tip (I) before and after administration of ATP in wild type (n=9) and Arl13b null cells (n=11). Data shown are mean ± SEM. *P<0.05 (Student’s t-test, p = 0.002). (J, K) Changes in calcium indicator (GECO-RFP)/GFP fluorescence intensity at cilia base (Arrow [D, K]; J) and tip (Arrowhead [D, F]; K) before (−ATP, T=0) and after ATP (+ATP) in wild type (n=9) and Arl13b null cilia (n=11). Data shown are mean ± SEM. *P<0.05 (Student’s t-test, p[J] = 0.0006, p[K] = 0.0002). (L–M) Time-lapse imaging of spontaneous calcium dynamics in interneuronal primary cilia from Nkx2.1Cre; Arl13blox/+; Ai9 (L) and Nkx2.1Cre; Arl13blox/lox; Ai9 (M) striatum. Arrowheads and arrow point to dynamic calcium hot spots in control cilia. Such hot spots are comparatively rare in Arl13b deficient cilia (N). Data shown are mean ± SEM. *P<0.05 (Student’s t-test, p[N] = 0.0005). Scale bar, 2μm (A, B, L, M); 1.4μm (D–G). See also Figure S4.
Figure 5
Figure 5. Primary cilia-driven Sstr3 signaling regulates interneuron morphology and connectivity
(A–C) Striatal tdTom+ INs in Nkx2.1Cre; Arl13blox/+; Ai9 (A), Nkx2.1Cre; Arl13blox/lox; Ai9 (B), and Nkx2.1Cre; Arl13blox/lox; Ai9; Sstr3-GFP (C) brains [P30]. (A′–C′) Higher-magnification images of tdTom+ striatal INs from outlined area in panels A–C. (D) Induced Sstr3-GFP expression in primary cilia of Nkx2.1Cre; Arl13blox/lox; Sstr3-GFP; Ai9 INs. (E) Altered Sstr3 localization in Arl13b deficient IN primary cilia and re-expression after induction of Sstr3-GFP. Co-labeling of primary cilia with anti-ACIII and anti-Sstr3 antibodies in Nkx2.1Cre; Arl13blox/+; Ai9, Nkx2.1Cre; Arl13blox/lox; Ai9 and Nkx2.1Cre; Arl13blox/lox; Ai9+; Sstr3-GFP INs. (F–K) Perisomatic boutons (arrowheads) labeled with tdTom (F–H) and anti-VGAT antibodies (I–K) in Nkx2.1Cre; Arl13blox/+; Ai9 (F, I), Nkx2.1Cre; Arl13blox/lox; Ai9 (G, J) and Nkx2.1Cre; Arl13blox/lox; Sstr3-GFP; Ai9 (H, K) brains [P30]. (L–M) Quantification of tdTom+ perisomatic bouton density (L) and size (M). Data shown are mean ± SEM. *P<0.05 (One-way ANOVA: F2,42 [L] = 23.0; p = 5.53616E-07; post-hoc p[L, lox/+ vs. lox/lox] = 6.08809E-08, post-hoc p[L, lox/lox vs. lox/lox-Sstr3] = 3.26839E-05; F2,42 [M] = 6.54; p = 0.004; post-hoc p[M, lox/+ vs. lox/lox] = 3.64284E-05, post-hoc p[M, lox/lox vs. lox/lox-Sstr3] = 0.008). n = 15 cells from 3 different brains per group. (N–O) Quantification of VGAT+ perisomatic bouton density (N) and size (O). Data shown are mean ± SEM. *P<0.05 (One-way ANOVA: F2,42 [N] = 13.35; p = 5.6345E-05; post-hoc p[N, lox/+ vs. lox/lox] = 5.21332E-06, post-hoc p[N, lox/lox vs. lox/lox-Sstr3] = 0.004; F2,42 [O] = 17.68; p = 6.04031E-06; post-hoc p[O, lox/+ vs. lox/lox] = 4.23172E-06, post-hoc p[O, lox/lox vs. lox/lox-Sstr3] = 0.0009). n = 15 cells from 3 different brains per group. (P–U) Patch-clamp electrophysiological recordings of striatal MSNs from Nkx2.1Cre; Arl13blox/+; Ai9 (control, n=6), Nkx2.1Cre; Arl13blox/lox; Ai9 (mutant, n=10) and Nkx2.1Cre; Arl13blox/lox; Sstr3-GFP; Ai9 (rescue, n=4) brains. (P, S) Representative patch-clamp electrophysiological recordings from MSNs showing mIPSCs (P) and mEPSCs (S). (Q, R) Quantification of mIPSC frequency (Q) and amplitude (R). *P<0.05 (One-way ANOVA, mIPSC frequency: F2,20 = 7.7; p = 0.003; post-hoc p[ctrl vs. IN cKO] < 0.01, post-hoc p[Rescue vs. IN cKO] < 0.05; control, n = 6; IN cKO, n = 11; rescue, n = 6). (T, U) Quantification of mEPSC frequency (T) and amplitude (U). (V) Rescue of overall excitatory/inhibitory ratio in striatal MSNs of Nkx2.1Cre; Arl13blox/lox; Sstr3-GFP; Ai9 mice. Data shown are mean ± SEM. *P<0.05 (One-way ANOVA: F2,19 = 4.8; p = 0.021; post-hoc p[ctrl vs. IN cKO] < 0.05, p[Rescue vs. IN cKO] < 0.05; control, n = 6; IN cKO, n = 10; rescue, n = 6). Scale bar, 37.6μm (A–C); 18μm (A′–C′); 6.2μm (D); 1.3μm (E); 5μm (F–K). See also Figure S5.
Figure 6
Figure 6. DREADD mediated chemogenetic activation of primary cilia-GPCR signaling rescues morphological and synaptic defects in Arl13b deficient interneurons
(A) Expression of Cilia-hM3Dq in the primary cilia of tdTom+ control interneurons. (B) Changes in ciliary Ca2+ dynamics upon CNO (10μM) exposure in control INs expressing Cilia-hM3Dq (green) and Cilia-R-GECO1.0 (red). Arrowhead indicates cilia tip from where changes in fluorescence intensity were measured. Insets (B) show changes of fluorescence intensity in pseudocolor (Red [High], Blue [Low]). Time elapsed is indicated in seconds. (C) Quantification of changes in cilia-GECO1.0 intensity upon CNO treatment. Data shown are mean ± SEM. *P<0.05 (Student’s t-test, p = 0.0006). 15 cells from 3 independent experiments were analyzed per group. (D–F) Activation of ciliary GPCR signaling rescued Arl13b deficient phenotype. Anti-VGAT antibody labeled tdTom+ INs from Nkx2.1Cre; Arl13blox/+; Ai9 (D), and Nkx2.1Cre; Arl13blox/lox; Ai9 mice expressing Cilia-hM3Dq (E, F). INs in D–E and F were treated with DMSO and CNO, respectively. Insets (E, F) show high-magnification images of Cilia-hM3Dq expression (arrowhead). (D′–F′) High-magnification images of axonal segments in D–F showing VGAT+ synaptic boutons (arrowheads). (G, H) Quantification of VGAT+ synaptic bouton density (I) and size (J) in tdTom+ interneurons. Data shown are mean ± SEM. *P<0.05 (One-way ANOVA: F2,33[G] = 15.92; p[G] = 1.44379E-05; post-hoc p[G][lox/+ vs. lox/lox (DMSO) = 5.46811E-06, p[G][lox/lox (CNO) vs. lox/lox (DMSO) = 0.0002; F2,33[H] = 13.07; p[H] = 6.59073E-05; post-hoc p[H][lox/+ vs. lox/lox (DMSO) = 8.88938E-05, p[H][lox/lox (CNO) vs. lox/lox (DMSO) = 0.001). 12 cells from 3 independent experiments were analyzed per group. Scale bar, 5.4μm (A); 2μm (B); 40μm (D–F); 7.8μm (D′–F′). See also Figure S6.
Figure 7
Figure 7. The effect of Jourbert-Sydrome linked human ARL13B alleles in Arl13b deficient interneurons
(A) Schematic of human ARL13B mutations and mouse non-cilia targeted Arl13b. (B–I) Dissociated INs from Nkx2.1Cre; Arl13blox/+; Ai9 (B) or Nkx2.1Cre; Arl13blox/lox; Ai9 (C–I) mice were transfected with AAV-mCherry (B, C), AAV-mCherry-ARL13B (D), R79Q (E), W82X (F), Y86C (G), R200C (H), and mV358A (I). Inset (I) shows non-ciliary expression of Arl13bV358A. (B′–I′) Labeling with anti-VGAT antibodies show inhibitory presynaptic boutons (arrowhead) along mCherry+ IN axons (B–I). (J, K) Quantification of total dendritic (J) and axonal length (K). (L, M) Quantification of VGAT+ bouton density (L) and size (M) along axons. Data shown are mean ± SEM. 12 cells from 3 independent experiments were analyzed per group. *P<0.05 (One-way ANOVA: F7,88 = 13.27[J], 17.61[K], 25.75[L], 23.52[M]; p = 1.43E-11[J], 2.11E-14[K], 8.13E-19[L], 1.06E-17[M]; post-hoc p[lox/+ vs. lox/lox = 0.001[J], 7.50E-08[K], 2.34E-06[L], 0.0003[M]; post-hoc p[lox/+ vs. lox/lox-ARL13B = 0.06[J], 0.1[K], 0.08[L], 0.09[M]; post-hoc p[lox/+ vs. lox/lox-R79Q] = 9.38E-06 [J], 6.50E-05[K], 6.44E-06[L], 0.0003[M]; post-hoc p[lox/+ vs. lox/lox-W82X] = 0.009 [J], 3.51E-08[K], 1.15E-05[L], 2.14E-06[M]; post-hoc p[lox/+ vs. lox/lox-Y86C] = 0.002 [J], 6.42E-06[K], 7.67E-08[L], 9.10E-06[M]; post-hoc p[lox/+ vs. lox/lox-R200C] = 0.46[J], 0.06[K], 0.002[L], 0.004[M]; post-hoc p[lox/+ vs. lox/lox-V358A] = 0.0001[J], 6.91E-05[K], 5.2771E-08[L], 1.63E-05[M]. Scale bar, 40μm (B–I); 10μm (B′–I′).

References

    1. Adamantidis A, Thomas E, Foidart A, Tyhon A, Coumans B, Minet A, Tirelli E, Seutin V, Grisar T, Lakaye B. Disrupting the melanin-concentrating hormone receptor 1 in mice leads to cognitive deficits and alterations of NMDA receptor function. The European journal of neuroscience. 2005;21:2837–2844. - PubMed
    1. Alvarez Retuerto AI, Cantor RM, Gleeson JG, Ustaszewska A, Schackwitz WS, Pennacchio LA, Geschwind DH. Association of common variants in the Joubert syndrome gene (AHI1) with autism. Human Molecular Genetics. 2008;17:3887–3896. - PMC - PubMed
    1. Amann-Zalcenstein D, Avidan N, Kanyas K, Ebstein RP, Kohn Y, Hamdan A, Ben-Asher E, Karni O, Mujaheed M, Segman RH, et al. AHI1, a pivotal neurodevelopmental gene, and C6orf217 are associated with susceptibility to schizophrenia. European journal of human genetics: EJHG. 2006;14:1111–1119. - PubMed
    1. Armbruster BA, Li X, Pausch MH, Herlitze S, Roth BL. Evolving the lock to fit the key to create a family of G protein-coupled receptors potently activated by an inert ligand. Proc Natl Acad Sci U S A. 2007;104:5163–5168. - PMC - PubMed
    1. Baraban SC, Southwell DG, Estrada RC, Jones DL, Sebe JY, Alfaro-Cervello C, García-Verdugo JM, Rubenstein JLR, Alvarez-Buylla A. Reduction of seizures by transplantation of cortical GABAergic interneuron precursors into Kv1.1 mutant mice. Proc Natl Acad Sci U S A. 2009;106:15472–15477. - PMC - PubMed

Publication types