. 2017 Aug 8;5(1):92.
doi: 10.1186/s40168-017-0284-4.

Transplanted human fecal microbiota enhanced Guillain Barré syndrome autoantibody responses after Campylobacter jejuni infection in C57BL/6 mice

Affiliations

Transplanted human fecal microbiota enhanced Guillain Barré syndrome autoantibody responses after Campylobacter jejuni infection in C57BL/6 mice

Phillip T Brooks et al. Microbiome. .

Abstract

Background: Campylobacter jejuni is the leading antecedent infection to the autoimmune neuropathy Guillain-Barré syndrome (GBS), which is accompanied by an autoimmune anti-ganglioside antibody attack on peripheral nerves. Previously, we showed that contrasting immune responses mediate C. jejuni induced colitis and autoimmunity in interleukin-10 (IL-10)-deficient mice, dependent upon the infecting strain. Strains from colitis patients elicited T helper 1 (TH1)-dependent inflammatory responses while strains from GBS patients elicited TH2-dependent autoantibody production. Both syndromes were exacerbated by antibiotic depletion of the microbiota, but other factors controlling susceptibility to GBS are unknown.

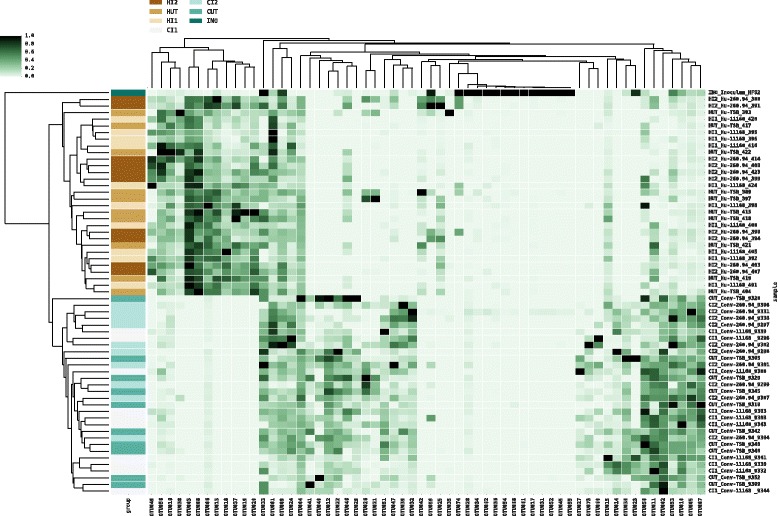
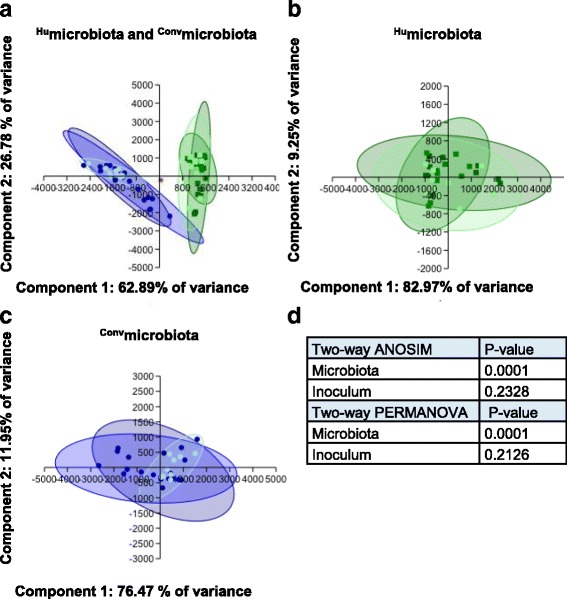
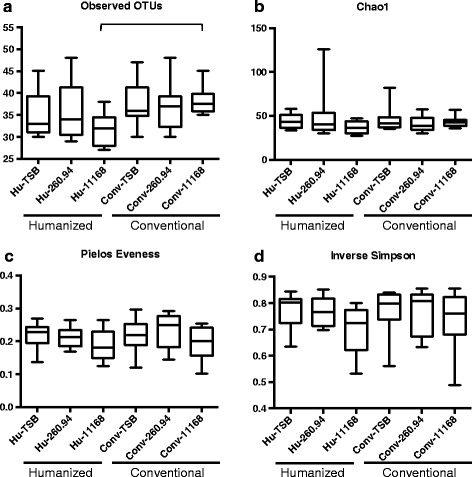
Methods: Using 16S rRNA gene high-throughput sequencing, we examined whether structure of the gut microbial community alters host (1) gastrointestinal inflammation or (2) anti-ganglioside antibody responses after infection with C. jejuni strains from colitis or GBS patients. We compared these responses in C57BL/6 mice with either (1) stable human gut microbiota (Humicrobiota) transplants or (2) conventional mouse microbiota (Convmicrobiota).

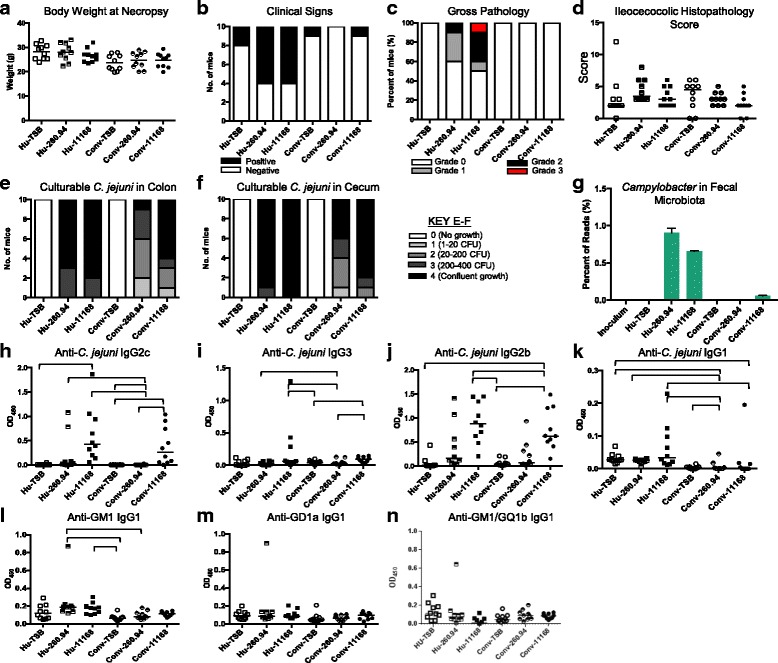
Results: Inoculating germ-free C57BL/6 wild-type (WT) mice with a mixed human fecal slurry provided a murine model that stably passed its microbiota over >20 generations. Mice were housed in specific pathogen-free (SPF) facilities, while extra precautions of having caretakers wear sterile garb along with limited access ensured that no mouse pathogens were acquired. Humicrobiota conferred many changes upon the WT model in contrast to previous results, which showed only colonization with no disease after C. jejuni challenge. When compared to Convmicrobiota mice for susceptibility to C. jejuni enteric or GBS patient strains, infected Humicrobiota mice had (1) 10-100 fold increases in C. jejuni colonization of both strains, (2) pathologic change in draining lymph nodes but only mild changes in colon or cecal lamina propria, (3) significantly lower Th1/Th17-dependent anti-C. jejuni responses, (4) significantly higher IL-4 responses at 5 but not 7 weeks post infection (PI), (5) significantly higher Th2-dependent anti-C. jejuni responses, and (6) significantly elevated anti-ganglioside autoantibodies after C. jejuni infection. These responses in Humicrobiota mice were correlated with a dominant Bacteroidetes and Firmicutes microbiota.

Conclusions: These data demonstrate that Humicrobiota altered host-pathogen interactions in infected mice, increasing colonization and Th-2 and autoimmune responses in a C. jejuni strain-dependent manner. Thus, microbiota composition is another factor controlling susceptibility to GBS.

Keywords: Autoimmunity; Broad-spectrum antibiotics; Campylobacter jejuni; Commensal microbiota; Gastrointestinal inflammation; Guillain-Barré syndrome; Mouse models.


Figures

Fig. 1
Fig. 1
Disease indicators: Pilot experiment. (a) body weight at necropsy, (b) clinical signs, (c) gross pathology at necropsy, (d) number of mice that are culture positive for C. jejuni in cecum or colon, and semi-quantitative representation of culturable C. jejuni in (e) colon and (f) cecum at necropsy. Panels g-m represent anti-Campylobacter (g-j) and anti-ganglioside antibodies (k-m) detected by indirect ELISA. Bars indicate statistical significance. Data were analyzed by Kruskal-Wallis test on ranks and Dunn’s post-test where appropriate; p≤0.05 considered statistically significant. The microbiota type of the mouse is indicated as Hu (Human microbiota) or Conv (Conventional microbiota) followed by their treatment group
Fig. 2
Fig. 2
Heat map of relative OTU abundance across samples. Abundances were measured as proportions of samples and the 60 most abundant OTUs are shown. Samples and OTUs were clustered hierarchically based on relative abundance profiles. On the right y-axis labels represent individual samples starting with group labels. Group labels; HI2= Humanized-Infected-260.94, HUT= Humanized-Uninfected-TSB, HI1= Humanized-Infected-11168, CI2= Conventional-Infected-260.94, CUT= Conventional-Uninfected-TSB, CI1= Conventional-Infected-11168, INO= Inoculum. The left y-axis represents the color-coded groups shown in the legend. OTUs are represented on the x-axis with corresponding relative abundances shown in the heatmap grid with increasing abundance from light green to black
Fig. 3
Fig. 3
Relative abundance of major bacterial orders in fecal microbiota (a-f). Data represent relative abundances of OTUs assigned at the Order level with the exception of the family Lactobacillaceae. Orders constituting ≥5% of the average abundance for a single group were included. The average percentage of reads within each order that were assigned to families are represented as proportions of the orders bar
Fig. 4
Fig. 4
Principal component analysis (PCA) and multivariate statistics of 16S rRNA taxonomy. PCA modeling was performed using OTU assignments. Resulting plots show separation by microbiota (a) but not inoculum (b and c). Dots represent; dark blue = Conv-11168, blue = Conv-260.94, light blue = Conv-TSB, dark green = Hu-11168, green = Hu-260.94, light green = Hu-TSB, and red = Inoculum. d Two-way ANOSIM and two-way PERMANOVA indicate statistically significant differences between microbiota but not the inoculum
Fig. 5
Fig. 5
Alpha-diversity indices for 16S rRNA gene sequences. Panels represent (a) observed OTU’s, (b) estimated richness (Chao1), (c) species evenness (Pielos), and (d) species diversity (inverse Simpson). Data were analyzed by Kruskal-Wallis test on ranks and Dunn’s post-test; P≤0.05 was considered statistically significant. Whiskers represent minimum and maximum values. All other points are contained within the box and the bar represents the median
Fig. 6
Fig. 6
Humicrobiota mice are more susceptible to C. jejuni colonization, GI inflammation and antiganglioside antibodies than Convmicrobiota mice. Data represent (a) body weight at necropsy, (b) clinical signs, (c) gross pathology, (d) ileocecocolic histopathology scores, (e) culturable C. jejuni in colon, (f) culturable C. jejuni in cecum, and (g) percentage of 16S rRNA amplicons assigned to the genus Campylobacter. Panels h to k are isotype specific anti-Campylobacter antibody responses in plasma detected by indirect ELISA. Panels l, m and n show anti-ganglioside antibody responses in plasma detected by indirect ELISA. Data were analyzed by Kruskal-Wallis test on ranks and Dunn’s post-test where appropriate; p≤0.05 considered statistically significant
Fig. 7
Fig. 7
C. jejuni infected Humicrobiota mice have significantly elevated colon IL-4 cytokine responses at five but not seven weeks post infection when compared to sham inoculated Humicrobiota mice or C. jejuni infected Convmicrobiota mice. Panels represent fold change in interferon gamma (IFN-γ) (a and c) and IL-4 responses (b and d) over responses of the sham inoculated mice. Panels a and b are from mice in the Pilot experiment sacrificed at 5 weeks post infection while panels c and d are from mice in Experiment 1 sacrificed at 7 weeks post infection. IFN-γ and IL-4 mRNA levels were measured in proximal colon homogenates from all mice in the respective groups shown on the X axis. Data were analyzed by Kruskal-Wallis test on ranks and Dunn’s post-test where appropriate; p≤0.05 was considered statistically significant
Fig. 8
Fig. 8
Behavioral phenotyping in the open-field test. Number of (a) Quadrants crossed and (b) Rears in the open-field one-week prior to inoculation (i.e. baseline) and 1 to 7 weeks post-inoculation. Boxes represent 95% confidence intervals and whiskers represent range. Lines represent the median of Convmicrobiota (red) and Humicrobiota (blue) mice regardless of inoculation status. Data were analyzed by repeated measures two-way analysis of variance (ANOVA) and Tukey’s post-test; p≤0.05 indicates statistical significance (reported in results). The key shows the color of each experimental group

Similar articles

Cited by

References

    1. Mathis D, Benoist C. Microbiota and autoimmune disease: the hosted self. Cell Host Microbe. 2011;10(4):297–301. doi: 10.1016/j.chom.2011.09.007. - DOI - PubMed
    1. Chervonsky AV. Microbiota and autoimmunity. Cold Spring Harb Perspect Biol. 2013;5(3):a007294. doi: 10.1101/cshperspect.a007294. - DOI - PMC - PubMed
    1. Rosenblum MD, Remedios KA, Abbas AK. Mechanisms of human autoimmunity. J Clin Invest. 2015;125(6):2228–33. doi: 10.1172/JCI78088. - DOI - PMC - PubMed
    1. Buffie CG, Pamer EG. Microbiota-mediated colonization resistance against intestinal pathogens. Nat Rev Immunol. 2013;13(11):790–801. doi: 10.1038/nri3535. - DOI - PMC - PubMed
    1. Kamada N, Chen GY, Inohara N, Nunez G. Control of pathogens and pathobionts by the gut microbiota. Nat Immunol. 2013;14(7):685–90. doi: 10.1038/ni.2608. - DOI - PMC - PubMed

MeSH terms

LinkOut - more resources