. 2017 Nov;76(11):1924-1930.
doi: 10.1136/annrheumdis-2017-211351. Epub 2017 Aug 8.

Dominant B cell receptor clones in peripheral blood predict onset of arthritis in individuals at risk for rheumatoid arthritis

Affiliations

Dominant B cell receptor clones in peripheral blood predict onset of arthritis in individuals at risk for rheumatoid arthritis

Paul P Tak et al. Ann Rheum Dis. 2017 Nov.

Retraction in

Abstract

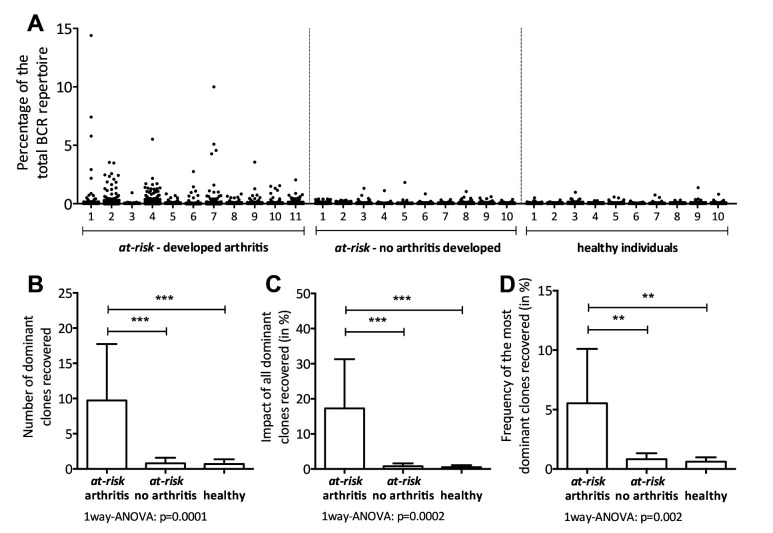
Background: The onset of seropositive rheumatoid arthritis (RA) is preceded by the presence of specific autoantibodies in the absence of synovial inflammation. Only a subset of these at-risk individuals will develop clinical disease. This impedes efforts to implement early interventions that may prevent onset of clinically manifest disease. Here we analyse whether clonal changes in the B cell receptor (BCR) repertoire can reliably predict onset of signs and symptoms.

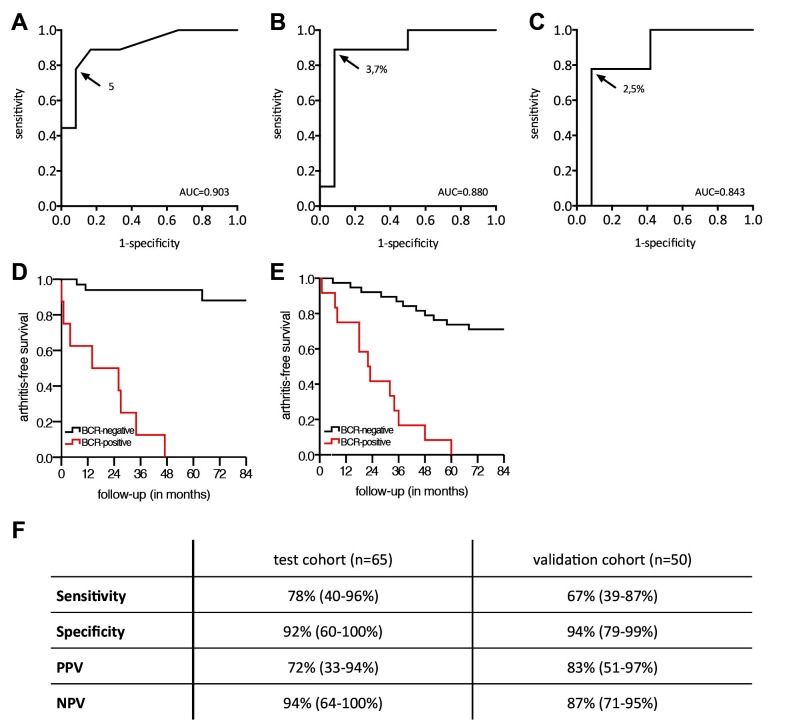
Methods: In a prospective cohort study in 21 individuals at risk for RA based on the presence of autoantibodies, the BCR repertoire of paired peripheral blood and synovial tissue samples was analysed using next-generation BCR sequencing. BCR clones that were expanded beyond 0.5% of the total repertoire were labelled dominant. The relative risk (RR) for onset of arthritis was assessed using the presence of ≥5 dominant BCR clones as cut-off. Findings in peripheral blood were validated in an independent prospective cohort of 50 at-risk individuals. Based on the test cohort, individuals in the validation cohort were considered positive if peripheral blood at study entry showed ≥5 dominant BCR clones.

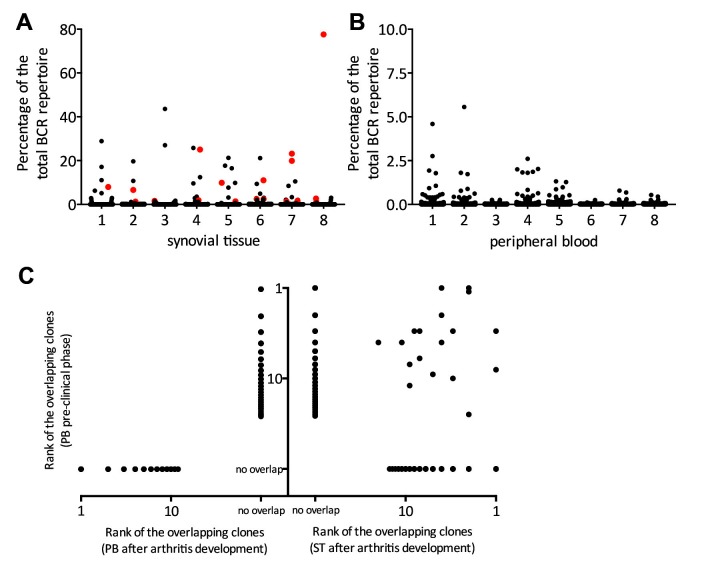
Findings: Both in the test and validation cohort, the presence of ≥5 dominant BCR clones in peripheral blood was significantly associated with arthritis development after follow-up (validation cohort RR 6.3, 95% CI 2.7 to 15, p<1×10⁻⁴). Even when adjusted for a recently described clinical prediction rule the association remained intact (RR 5.0, 95% CI 1.2 to 20, p=0.024). When individuals developed arthritis, dominant BCR clones disappeared from peripheral blood and appeared in synovial tissue, suggesting a direct role of these clones in disease pathogenesis.

Interpretation: Dominant BCR clones in peripheral blood predict onset of clinical signs and symptoms of RA in at-risk individuals with high accuracy. Our data suggest that during onset of RA these clones shift from peripheral blood to the target tissue.

Keywords: B cells; arthritis; early rheumatoid arthritis; synovitis.


Conflict of interest statement

Competing interests: None declared.

Figures

Figure 1
Figure 1
(A) Scatterplot of the BCR repertoire in peripheral blood of 11 at-risk individuals who developed arthritis (at-risk - developed arthritis), 10 at-risk individuals who did not develop arthritis (at-risk - no arthritis developed) and 10 autoantibody negative healthy individuals. Each dot represents one clone. The size of the clones is depicted as percentage of the total BCRheavy sequences. (B) The absolute number of dominant BCR clones (clonal size ≥0.5% of the total repertoire), (C) the impact of all dominant clones combined and (D) the size of the single most dominant clone, in at-risk individuals who developed arthritis (at-risk arthritis, n=11) versus at-risk individuals who did not develop arthritis yet (at-risk no arthritis, n=10), and healthy individuals (healthy, n=10). Bars show mean and SD, ***p<0.0001, **p<0.001 using one-way ANOVA. ANOVA, analysis of variance; BCR, B-cell receptor.
Figure 2
Figure 2
Receiver operating characteristic curves for (A) the number of dominant clones, (B) the impact of all dominant clones combined and (C) the impact of the most dominant clone in at-risk individuals (n=21). The development of arthritis was analysed after 36 months of follow-up. The arrow points to the cut-off value chosen, and the corresponding value is shown. (D) Kaplan-Meier curve for BCR-clone positive and BCR-clone negative individuals in the test cohort, assuming the at-risk individuals analysed represent a random selection of the total at-risk individuals (n=65). (E) Kaplan-Meier curve for BCR-clone positive and BCR-clone negative individuals in the validation cohort. (F) Table describing sensitivity, specificity, PPV and NPV including 95% CIs for the BCR-clone model, in the test cohort and the validation cohort. AUC, area under the curve; BCR, B-cell receptor; NPV, negative predictive value; PPV, positive predictive value.
Figure 3
Figure 3
Scatterplot of the BCR repertoire in synovial tissue (A) and peripheral blood (B) after arthritis development in eight patients. Each dot represents one clone. Clones in red represent clones that were dominantly present in peripheral blood during the preclinical phase. The size of the clones is depicted as percentage of the total BCRheavy sequences. (C) Dot plot showing the overlap between dominant BCR clones in the preclinical phase and after arthritis development (n=8). The y-axis depicts the rank of the clones found in blood during the preclinical phase (all eight patients pooled). On the left x-axis the overlap with dominant clones in peripheral blood after arthritis development, on the right x-axis the overlap with dominant clones in synovial tissue after arthritis development. In case no overlap was found, the dots were marked ‘no overlap.’ BCR, B-cell receptor; PB, peripheral blood; ST, synovial tissue.

References

    1. Nielen MM, van Schaardenburg D, Reesink HW, et al. Specific autoantibodies precede the symptoms of rheumatoid arthritis: a study of serial measurements in blood donors. Arthritis Rheum 2004;50:380–6. 10.1002/art.20018 - DOI - PubMed
    1. van de Sande MG, de Hair MJ, van der Leij C, et al. Different stages of rheumatoid arthritis: features of the synovium in the preclinical phase. Ann Rheum Dis 2011;70:772–7. 10.1136/ard.2010.139527 - DOI - PubMed
    1. de Hair MJ, van de Sande MG, Ramwadhdoebe TH, et al. Features of the synovium of individuals at risk of developing Rheumatoid arthritis: implications for understanding preclinical rheumatoid arthritis. Arthritis Rheumatol 2014;66:513–22. 10.1002/art.38273 - DOI - PMC - PubMed
    1. Berger T, Rubner P, Schautzer F, et al. Antimyelin antibodies as a predictor of clinically definite multiple sclerosis after a first demyelinating event. N Engl J Med 2003;349:139–45. 10.1056/NEJMoa022328 - DOI - PubMed
    1. Wasserfall CH, Atkinson MA. Autoantibody markers for the diagnosis and prediction of type 1 diabetes. Autoimmun Rev 2006;5:424–8. 10.1016/j.autrev.2005.12.002 - DOI - PubMed

Publication types