Heteromeric channels formed by TRPC1, TRPC4 and TRPC5 define hippocampal synaptic transmission and working memory
- PMID: 28790178
- PMCID: PMC5599800
- DOI: 10.15252/embj.201696369
Heteromeric channels formed by TRPC1, TRPC4 and TRPC5 define hippocampal synaptic transmission and working memory
Abstract
Canonical transient receptor potential (TRPC) channels influence various neuronal functions. Using quantitative high-resolution mass spectrometry, we demonstrate that TRPC1, TRPC4, and TRPC5 assemble into heteromultimers with each other, but not with other TRP family members in the mouse brain and hippocampus. In hippocampal neurons from Trpc1/Trpc4/Trpc5-triple-knockout (Trpc1/4/5-/-) mice, lacking any TRPC1-, TRPC4-, or TRPC5-containing channels, action potential-triggered excitatory postsynaptic currents (EPSCs) were significantly reduced, whereas frequency, amplitude, and kinetics of quantal miniature EPSC signaling remained unchanged. Likewise, evoked postsynaptic responses in hippocampal slice recordings and transient potentiation after tetanic stimulation were decreased. In vivo, Trpc1/4/5-/- mice displayed impaired cross-frequency coupling in hippocampal networks and deficits in spatial working memory, while spatial reference memory was unaltered. Trpc1/4/5-/- animals also exhibited deficiencies in adapting to a new challenge in a relearning task. Our results indicate the contribution of heteromultimeric channels from TRPC1, TRPC4, and TRPC5 subunits to the regulation of mechanisms underlying spatial working memory and flexible relearning by facilitating proper synaptic transmission in hippocampal neurons.
Keywords: TRPC1/C4/C5 heteromeric assembly; cross‐frequency coupling; hippocampal synaptic transmission; relearning; spatial working memory.
© 2017 The Authors.
Figures


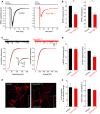
- A
Exemplary recordings of evoked EPSCs from autaptic hippocampal neurons.
- B
Summary plots for EPSC parameters. The loss of TRPC1, TRPC4, and TRPC5 reduces the amplitude (**P = 0.0058) and charge of EPSCs (*P = 0.032) (n = 63 for Trpc1/4/5 −/−, n = 66 for controls). Statistical significance was determined using two‐tailed unpaired Student's t‐test.
- C, D
(C) Exemplary recordings of mEPSCs from neurons in mass culture. The cumulative frequency distribution of mEPSC amplitude and charge, as well as the quantitative analyses of both frequency and amplitude (D), shows that TRPC1/4/5 deficiency does not alter the properties of quantal signaling (n = 14 for Trpc1/4/5 −/−, n = 20 for controls).
- E
Representative epifluorescence images of neurons immunolabeled with synaptophysin. Scale bar (inset), 5 μm.
- F
The loss of TRPC channels does not alter the density of synapses determined per 50 μm length of neuronal processes or their respective size (n = 17 for Trpc1/4/5 −/−, n = 15 for controls).
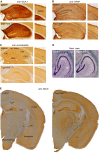
- A–C
Immunohistology of coronal brain sections illustrates comparable patterns of GluA1 (A), GFAP (B), and somatostatin (C) expression in Trpc1/4/5 −/− and control mice. (B) The number of glial cells (mean ± SEM) is as follows (Trpc1/4/5 −/− versus controls): in CA1: subgranular zone: 69.00 ± 6.66 versus 70.67 ± 6.23 (P = 0.8638), Str. moleculare: 110.00 ± 15.63 versus 89.00 ± 6.08 (P = 0.2788), Str. lacunosum: 100.33 ± 9.91 versus 109.67 ± 6.12 (P = 0.4677), Str. radiatum: 121.00 ± 16.29 versus 118.00 ± 12.66 (P = 0.8914), Str. pyramidale: 52.67 ± 3.18 versus 53.00 ± 5.51 (P = 0.9607), Str. oriens: 90.67 ± 2.19 versus 88.00 ± 5.57 (P = 0.6788); in the cortex sector (1.2 × 1.7 mm): 109.00 ± 17.78 versus 128.33 ± 4.26 (P = 0.3498); the right cerebral hemispheres of three mice per genotype were analyzed. (C) The number of somatostatin‐positive interneurons (mean ± SEM) is (Trpc1/4/5 −/− versus controls): CA1: 100.50 ± 9.28 versus 78.33 ± 15.21 (P = 0.2419), CA2: 14.33 ± 0.99 versus 15.67 ± 1.71 (P = 0.5143), CA3: 65.17 ± 8.31 versus 52.17 ± 6.94 (P = 0.2577), hilus: 37.00 ± 3.16 versus 34.50 ± 2.63 (P = 0.5569); both cerebral hemispheres of three mice per genotype were analyzed.
- D
Nissl staining of horizontal sections does not reveal any obvious changes in neuronal patterns of mutant and control mice. The thickness of the somata containing cell layer (μm; mean ± SEM) is (Trpc1/4/5 −/− versus controls): CA1: 29.33 ± 1.63 versus 32.14 ± 2.41 (P = 0.3449), CA3: 49.58 ± 4.99 versus 48.83 ± 3.70 (P = 0.9039), outer DG: 23.79 ± 0.85 versus 21.75 ± 1.21 (P = 0.1819); in two independent tissue slices, both cerebral hemispheres were analyzed in three mice per genotype.
- E
The thickness of the cortex layer in anti‐NeuN immunostainings was comparable in control and Trpc1/4/5 −/− mice (μm; mean ± SEM): 843.95 ± 17.05 versus 859.20 ± 42.87 (P = 0.7313); both cerebral hemispheres of three mice per genotype were analyzed.

Scheme of experimental recording setup where video inputs (VIDEO) are synchronized (SYNC) to recorded local field potentials (LFPs) to the computer (PC).
Theta and gamma frequencies are not different between groups. Curves shown as median and 25th and 75th percentiles (n = 5 for Trpc1/4/5 −/−, n = 5 for controls).
Peak frequencies for theta and gamma oscillations are not significantly different from each other for both groups (n = 5 for Trpc1/4/5 −/−, n = 5 for controls).
Cross‐frequency coupling during REM sleep shows reduced modulation of theta and low gamma for Trpc1/4/5 −/− mice compared to controls (white arrows).
Raw LFPs and filtered LFPs for theta and gamma show diffuse distribution of gamma on theta oscillations for Trpc1/4/5 −/− mice (red shades) when compared to controls, where gamma is superimposed mainly on the peak of theta cycles (gray shades) with the typical waning/waxing appearance.
Theta and low gamma power is not significantly different between control (n = 5) and Trpc1/4/5 −/− mice (n = 5).
Modulation index (MI) for low gamma during REM sleep is reduced in Trpc1/4/5 −/− (n = 5) when compared to controls (n = 5; *P = 0.0179). CTR, control; TKO, Trpc1/4/5 −/−.
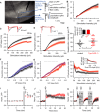
(Left) Stimulation of Schaffer collaterals (CA3 axons). Recording electrodes (1) in stratum radiatum (2) and stratum pyramidale (3). (Right) Example traces of recording in stratum radiatum (top) and at the same time in stratum pyramidale (bottom).
Fiber volley in stratum radiatum as a measure for presynaptic axonal spiking versus stimulation intensity (n = 21 (11 mice) for Trpc1/4/5 −/−, n = 15 (9 mice) for controls; P = 0.3427, two‐way ANCOVA of type II).
Input–output curve of LFPs versus stimulation intensity. No significant differences between control and Trpc1/4/5 −/− outside dashed line (n = 21 for Trpc1/4/5 −/−, n = 15 for controls; P < 0.0001, two‐way ANCOVA of type II).
Input–output curve of population spikes versus stimulation intensity (n = 21 for Trpc1/4/5 −/−, n = 15 for controls; P = 0.0006, two‐way ANCOVA of type II). No significant differences between control and Trpc1/4/5 −/− outside dashed line.
Baseline stimulation intensity used in LTP/depotentiation experiments in control and Trpc1/4/5 −/− slices (P = 0.0118, t‐test). Inset, baseline LFPs (n = 21 for Trpc1/4/5 −/−, n = 15 for controls; P = 0.9906, t‐test).
“E‐S curve” of LFP (“E”) versus population spike (“S”) of control slices at the first (black) and at the second (blue) pulse of a 50‐ms paired pulse (n = 13 (9 mice); P = 0.0011, two‐way ANCOVA of type II). No significant differences between first and second pulse outside dashed line.
“E‐S curve” of Trpc1/4/5 −/− at the first (red) and at the second (purple) pulse of a 50‐ms paired pulse (n = 18 (10 mice); P < 0.0001, two‐way ANCOVA of type II). No significant differences between first and second pulse outside dashed line. Of note, no difference in the first pulse between control (from F) and Trpc1/4/5 −/− E‐S curve (P = 0.329, two‐way ANCOVA of type II).
LFP paired‐pulse ratio (50‐ms interstimulus interval) versus stimulation intensity (n = 18 (10 mice) for Trpc1/4/5 −/−, n = 13 (9 mice) for controls; P = 0.0007, two‐way ANCOVA of type II) and versus the corresponding first pulse (inset, P = 0.0724, two‐way ANCOVA of type II).
Baseline‐normalized LFP versus time, before, and after 100‐Hz stimulation (arrow 1) (n = 21 (10 mice) for Trpc1/4/5 −/−, n = 15 (10 mice) for controls). The first minute (**P = 0.0066, t‐test on absolute LFPs) and the second minute (*P = 0.0417, t‐test) after 100‐Hz stimulation, control and Trpc1/4/5 −/− are differently potentiated.
Baseline‐normalized LFP versus time in one subset of (I), before and after 100‐Hz stimulation (arrow 1). Both control (P = 0.0136, t‐test on absolute LFPs) and Trpc1/4/5 −/− (P = 0.0033, t‐test on absolute LFPs) exhibit LTP (n = 10 (5 mice) for Trpc1/4/5 −/−, n = 8 (6 mice) for controls) with no difference in magnitude (relative LFP) between control and Trpc1/4/5 −/− (P = 0.1457, Wilcoxon signed‐rank test).
In the second subset of (I) baseline‐normalized LFP versus time, at baseline, 5 min after 100‐Hz stimulation (arrow 1), 15 min after 1‐Hz paired‐pulse (200 ms) stimulation (arrow 2; P controls = 0.0378, P TKO = 0.0316), and 20 min after 1‐Hz paired‐pulse (50‐ms) stimulation (arrow 3; P controls = 0.2429, P TKO = 0.2888) (n = 10 (5 mice) for Trpc1/4/5 −/−, n = 7 (4 mice) for controls). CTR, control; TKO, Trpc1/4/5 −/−. Determination of the P‐values is described in Materials and Methods.
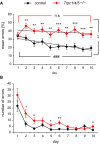
Number of errors per day in the delayed non‐match‐to‐place T‐maze task. Trpc1/4/5 −/− mice (n = 30) perform consistently worse than the controls (n = 30; days 2–10 P < 0.0067, Mann–Whitney U‐test). The maximum number of errors per day is 6. Analysis of the groups’ individual performance curves confirms that the controls learn to alternate their choices of visited arms (### P < 0.001, Poisson regression with GEE) as the test progresses—unlike the Trpc1/4/5 −/− animals. The learning curves of the two groups differ significantly (**P = 0.0015, Poisson regression with GEE).
Number of errors per day in the radial maze test. During the early test phase, the animals lacking TRPC1, TRPC4, and TRPC5 exhibit a higher rate of mistakes (n = 15 for Trpc1/4/5 −/−, n = 14 for controls; days 2, 3, 5, 10 *P < 0.05, day 6 **P < 0.01).
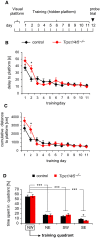
- A
Schematic representation of the experimental procedure.
- B, C
The delay (B) and cumulative distance (C) to reach the platform during the acquisition phase are shown. The search performance of all animals is comparable (only day 2 *P < 0.02).
- D
Relative time spent in the four quadrants of the swimming pool without hidden platform during the probe trial. Mice of both genotypes spend significantly more time (***P < 0.001) in the training quadrant compared to the other three quadrants. SE quadrant: *P < 0.03.
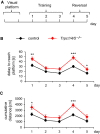
- A
Schematic representation of the experimental procedure.
- B, C
Mutant mice initially display increased delay (B) and cumulative distance (day 1 *P = 0.0129) (C) to the platform (day 1 **P = 0.0073), but comparable performances on the following two days show that both groups successfully learn to navigate to the hidden platform. TRPC1/4/5‐deficient mice perform worse when they are challenged to relearn a new goal position in the reversal part (days 4, 5 P < 0.05) (n = 30 for Trpc1/4/5 −/−, n = 30 for controls). Results are shown as mean ± SEM. Statistical significance was determined using two‐tailed unpaired Student's t‐test; ***P < 0.001, **P < 0.01, *P < 0.05.
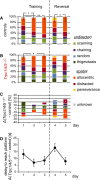
- A, B
Qualitative analysis of search strategies used by controls and Trpc1/4/5 −/− mice. Mice of both genotypes show a progression in their search to allocentric (orange) strategies during the training phase (control: day 1 versus 2 *P = 0.02, day 1 versus 3 **P = 0.004; Trpc1/4/5 −/− *P = 0.01), but only the control animals change and improve their allocentric search behavior after relocation of the platform in the reversal part. Trpc1/4/5 −/− had difficulties to change and adapt new allocentric search behavior.
- C
The proportion of individual search strategies of mutant mice was normalized to those of the controls. In Trpc1/4/5 −/− mice, the proportion of undirected swimming, especially thigmotaxis (dark green), is increased (days 1–5 ***P < 0.001), and allocentric strategies (orange) are less frequently used (day 3 *P = 0.03, day 5 ***P < 0.001). Notably, they also exhibit more often a random swim pattern (blue) during the reversal phase of the test (*P = 0.04).
- D
Mean difference between the groups in delay to the hidden platform correlates with deficits in efficient search modes (n = 30 for Trpc1/4/5 −/−, n = 30 for controls). Results are shown as mean ± SEM.
References
-
- Aggleton JP, Hunt PR, Rawlins JN (1986) The effects of hippocampal lesions upon spatial and non‐spatial tests of working memory. Behav Brain Res 19: 133–146 - PubMed
-
- Arns M, Sauvage M, Steckler T (1999) Excitotoxic hippocampal lesions disrupt allocentric spatial learning in mice: effects of strain and task demands. Behav Brain Res 106: 151–164 - PubMed
-
- Bannerman DM, Good MA, Butcher SP, Ramsay M, Morris RG (1995) Distinct components of spatial learning revealed by prior training and NMDA receptor blockade. Nature 378: 182–186 - PubMed
Publication types
MeSH terms
Substances
LinkOut - more resources
Full Text Sources
Other Literature Sources
Molecular Biology Databases
Miscellaneous

