. 2017 Aug 22;114(34):E7187-E7196.
doi: 10.1073/pnas.1708854114. Epub 2017 Aug 8.

Adiponectin protects against development of metabolic disturbances in a PCOS mouse model

Affiliations

Adiponectin protects against development of metabolic disturbances in a PCOS mouse model

Anna Benrick et al. Proc Natl Acad Sci U S A. .

Abstract

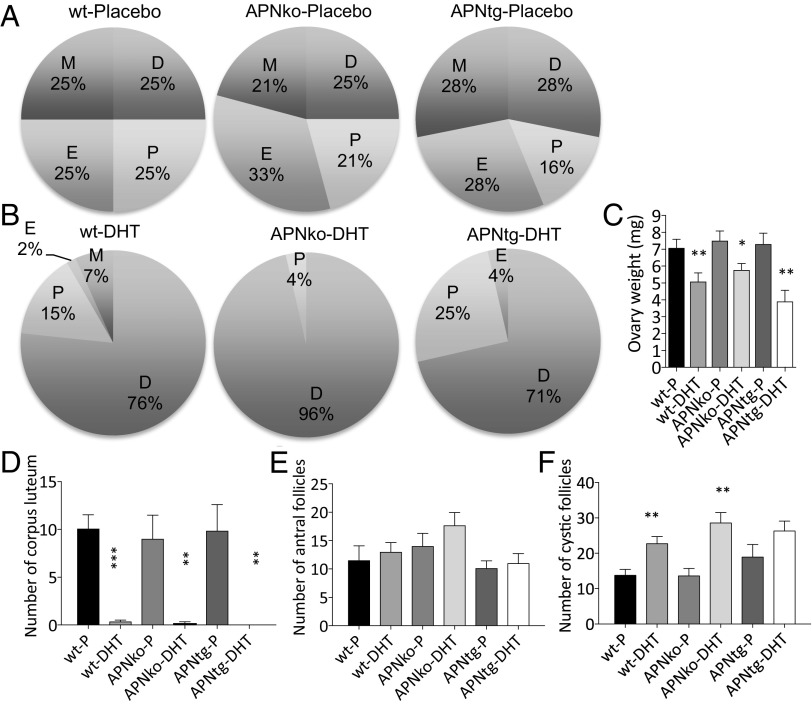
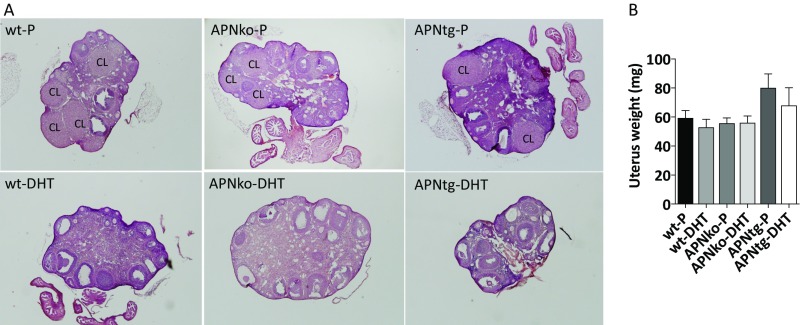
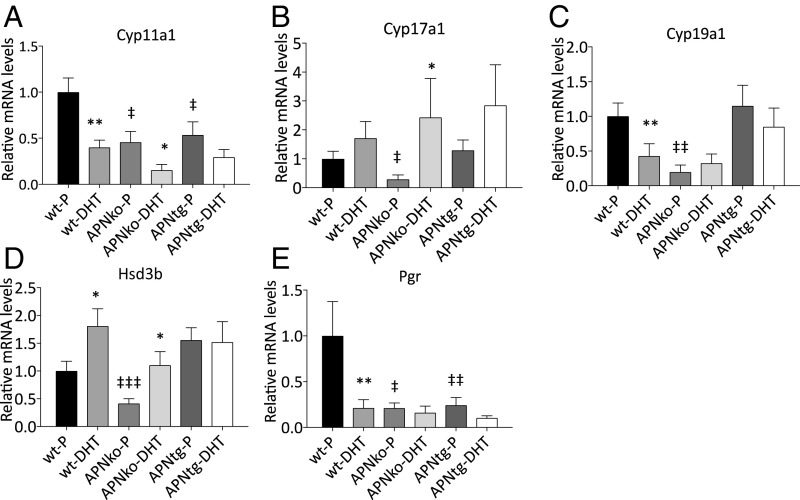
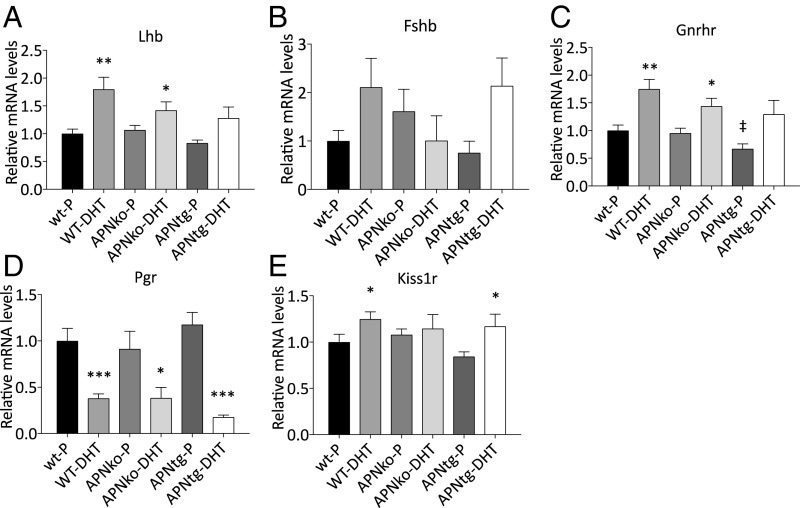
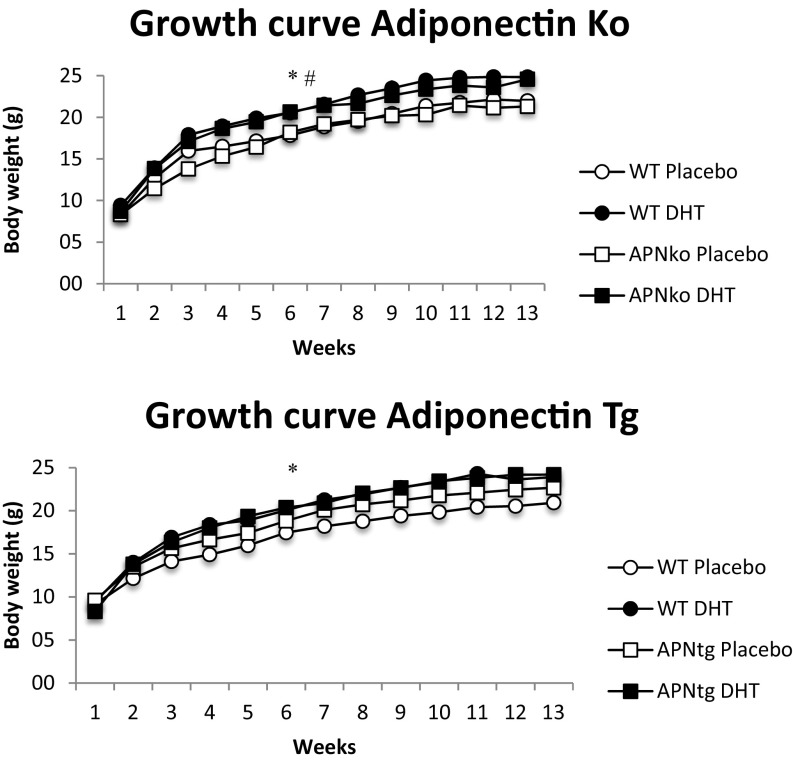
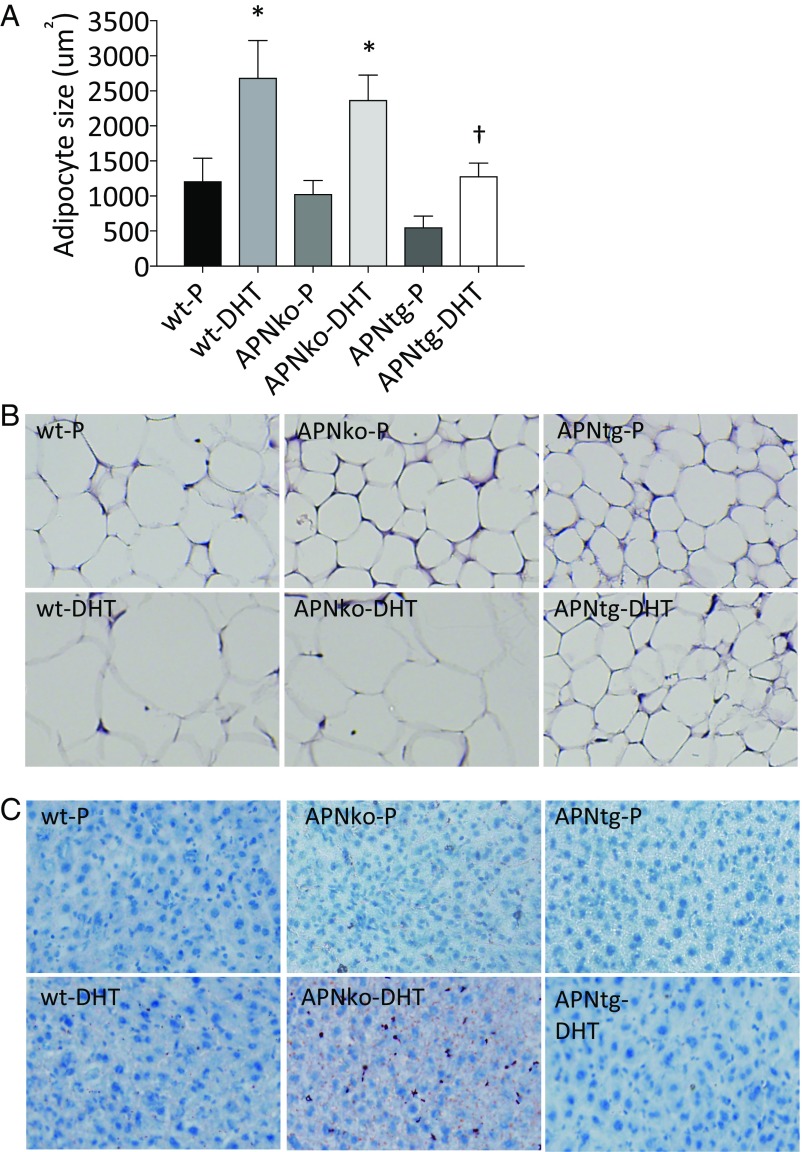
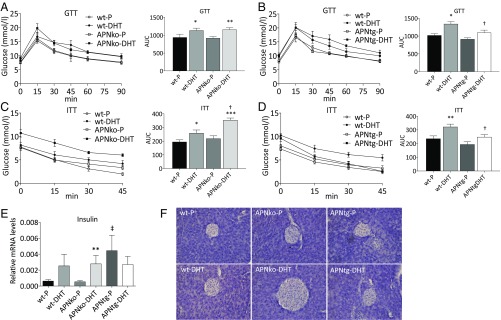
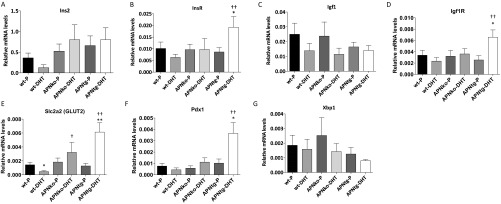
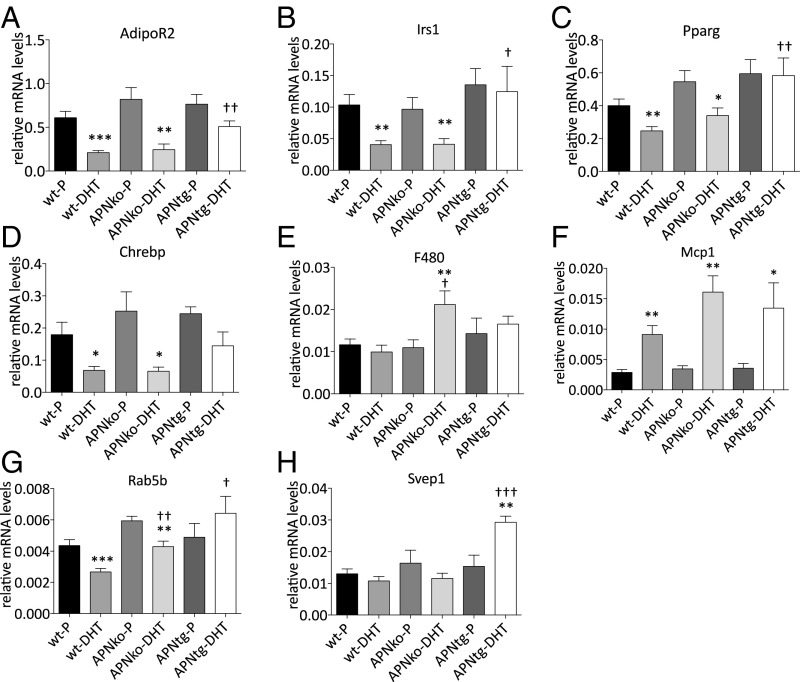
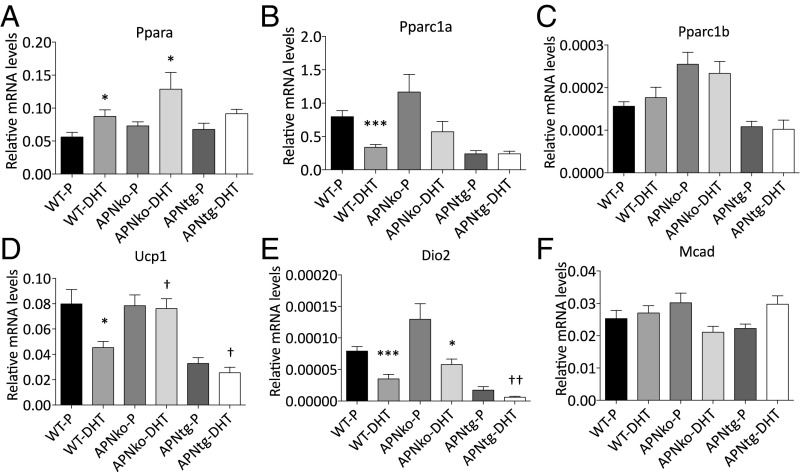
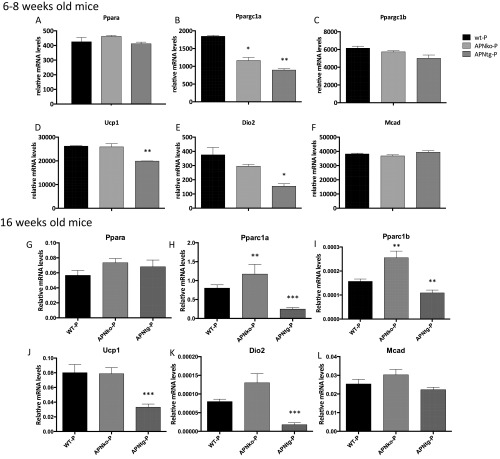
Adiponectin, together with adipocyte size, is the strongest factor associated with insulin resistance in women with polycystic ovary syndrome (PCOS). This study investigates the causal relationship between adiponectin levels and metabolic and reproductive functions in PCOS. Prepubertal mice overexpressing adiponectin from adipose tissue (APNtg), adiponectin knockouts (APNko), and their wild-type (WT) littermate mice were continuously exposed to placebo or dihydrotestosterone (DHT) to induce PCOS-like traits. As expected, DHT exposure led to reproductive dysfunction, as judged by continuous anestrus, smaller ovaries with a decreased number of corpus luteum, and an increased number of cystic/atretic follicles. A two-way between-groups analysis showed that there was a significant main effect for DHT exposure, but not for genotype, indicating adiponectin does not influence follicle development. Adiponectin had, however, some protective effects on ovarian function. Similar to in many women with PCOS, DHT exposure led to reduced adiponectin levels, larger adipocyte size, and reduced insulin sensitivity in WTs. APNtg mice remained metabolically healthy despite DHT exposure, while APNko-DHT mice were even more insulin resistant than their DHT-exposed littermate WTs. DHT exposure also reduced the mRNA expression of genes involved in metabolic pathways in gonadal adipose tissue of WT and APNko, but this effect of DHT was not observed in APNtg mice. Moreover, APNtg-DHT mice displayed increased pancreatic mRNA levels of insulin receptors, Pdx1 and Igf1R, suggesting adiponectin stimulates beta cell viability/hyperplasia in the context of PCOS. In conclusion, adiponectin improves metabolic health but has only minor effects on reproductive functions in this PCOS-like mouse model.

Keywords: adipose tissue; insulin resistance; polycystic ovary syndrome.


Conflict of interest statement

The authors declare no conflict of interest.

Figures

Fig. 1.
Fig. 1.
Estrous status in placebo (A) and DHT-exposed (B) mice, mean ovarian weights (C), number of corpus luteum (D), antral follicles (E), and cystic follicles (F) in ovaries from WT, APNko, and APNtg mice with and without DHT exposure (n = 7–10/group). D, diestrus; E, estrus; M, metestrus; P, proestrus. *P < 0.05, **P < 0.01, ***P < 0.001 for the effect of DHT within genotypes. Statistical significance was determined with a Mann–Whitney U test. Chi-square tests were used to analyze cyclicity.
Fig. S1.
Fig. S1.
Ovarian gene morphology (A) and mean uterus weights (B). Representative images of ovaries from WT, APNko, and APNtg mice with placebo or DHT exposure. CL, corpus luteum. The Mann–Whitney U test was performed to compare the effect of DHT within genotypes and between DHT-exposed groups.
Fig. 2.
Fig. 2.
Mean mRNA expression levels of Cyp11a1 (A), Cyp17a1 (B), Cyp19a1 (C), Hsd3b (D), and Pgr (E) in the ovaries from WT, APNko, and APNtg mice with and without DHT exposure (n = 7–10/group). *P < 0.05, **P < 0.01 for the effect of DHT within genotypes; P < 0.05, ‡‡P < 0.01 for the effect of genotype. A Mann–Whitney U test was performed to compare the effect of DHT within genotypes and between DHT-exposed groups.
Fig. 3.
Fig. 3.
Mean mRNA expression levels of Lhb (A), Fshb (B), Gnrhr (C), Pgr (D), and Kiss1r (E) in the pituitary in WT, APNko, and APNtg mice with and without DHT exposure (n = 7–10/group). *P < 0.05, **P < 0.01, ***P < 0.001 for the effect of DHT within genotypes; P < 0.05 for the effect of genotype. A Mann–Whitney U test was performed to compare the effect of DHT within genotypes and between DHT-exposed groups.
Fig. S2.
Fig. S2.
Growth curves for WT, APNko, and APNtg mice (n = 7–8/group). Values are mean ± SEM. *P > 0.05 WT-P vs. WT-DHT; #P > 0.05 APNko-P vs. APNko-DHT, using repeated measurement ANOVA.
Fig. 4.
Fig. 4.
Subcutaneous adipocyte size (A, n = 4/group) in WT, APNko, and APNtg mice. Histological sections showing s.c. adipose tissue (B) and Oil Red O staining in liver (C). *P < 0.05 for the effect of DHT within genotypes; P < 0.05 for the effect of DHT between genotypes. Values are mean ± SEM. A Mann–Whitney U test was performed to compare the effect of DHT within genotypes and between DHT-exposed groups. Chi-square tests were used to analyze liver steatosis.
Fig. S3.
Fig. S3.
(A) Representative H&E sections from the inguinal area of newborn pups (0, 6, and 12 h after birth) from APNtg and littermate controls at 4x magnification. Areas within the dashed lines are filled with cells containing lipid droplets (i.e., most likely newborn adipocytes), and these areas are larger in APNtg mice than in littermate WT controls. (B) Upper two rows show representative Oil Red O sections from inguinal adipose tissue of newborn pups (0 and 6 h after birth) from APNtg and littermate controls at 40× magnification. Lowest row shows representative H&E sections from inguinal adipose tissue of 12-h-old pups from APNtg and littermate controls at 40× magnification. APNtg mice display smaller lipid droplet size at 6 h of age and slightly smaller adipocyte size at 12 h of age. Overall, these data indicate that APNtg mice develop more, but smaller, adipocytes in their inguinal depot.
Fig. 5.
Fig. 5.
Oral glucose tolerance test (GTT; A and B), insulin tolerance test (ITT; C and D), gene expression of insulin in total pancreas (E) and histological pancreas sections showing islet size (F), in WT, APNko, and APNtg mice. *P < 0.05, **P < 0.01, ***P < 0.001 for the effect of DHT within genotypes; P < 0.05 for the effect of DHT between genotypes; P < 0.05 for the effect of genotype, n = 7–8/group in A–E. Values are mean ± SEM. A Mann–Whitney U test was performed to compare the effect of DHT within genotypes and between DHT-exposed groups.
Fig. S4.
Fig. S4.
Gene expression of Ins2 (A), Insr (B), Igf1 (C), Igf1r (D), Slc2a2 (Glut2) (E), Pdx1 (F), and Xbp1 (G) in total pancreas from WT, APNko, and APNtg mice. *P < 0.05, **P < 0.01 for the effect of DHT within genotypes; P < 0.05, ††P < 0.01 for the effect of DHT between genotypes. Values are mean ± SEM and the Mann–Whitney U test was performed to compare the effect of DHT within genotypes and between DHT-exposed groups.
Fig. 6.
Fig. 6.
Gene expression of AdipoR2 (A), Irs1 (B), Pparγ (C), Chrebp (D), F4/80 (E), Mcp1 (F), Rab5b (G), and Svep1 (H) in gonadal adipose tissue in WT, APNko, and APNtg mice. Data are expressed as mean 2ΔCt ± SEM. *P < 0.05, **P < 0.01, ***P < 0.001 for the effect of DHT within genotypes; P < 0.05, ††P < 0.01, †††P < 0.001 for the effect of DHT between genotypes, n = 7–8/group. A Mann–Whitney U test was performed to compare the effect of DHT within genotypes and between DHT-exposed groups.
Fig. 7.
Fig. 7.
Gene expression of Pparα (A), Pparc1α (B), Pparc1β (C), Ucp1 (D), Dio2 (E), and Mcad (F) in BAT in WT, APNko, and APNtg mice. Data are expressed as mean 2ΔCt ± SEM. *P < 0.05, ***P < 0.001 for the effect of DHT within genotypes; P < 0.05, ††P < 0.01 for the effect of DHT between genotypes, n = 7–8/group. A Mann–Whitney U test was performed to compare the effect of DHT within genotypes and between DHT-exposed groups.
Fig. S5.
Fig. S5.
Gene expression of Pparα (A, G), Pparc1α (B, H), Pparc1β (C, I), Ucp1 (D, J), Dio2 (E, K), and Mcad (F, L) in BAT in WT, APNko, and APNtg mice, n = 7–8/group. Data are expressed as mean 2ΔCt ± SEM. *P < 0.05, ***P < 0.001 for the effect of DHT within genotypes; P < 0.05, ††P < 0.01 for the effect of DHT between genotypes. The Mann–Whitney U test was performed to compare the effect of DHT within genotypes and between DHT-exposed groups.

References

    1. Teede H, Deeks A, Moran L. Polycystic ovary syndrome: A complex condition with psychological, reproductive and metabolic manifestations that impacts on health across the lifespan. BMC Med. 2010;8:41. - PMC - PubMed
    1. Corbould A. Insulin resistance in skeletal muscle and adipose tissue in polycystic ovary syndrome: Are the molecular mechanisms distinct from type 2 diabetes? Panminerva Med. 2008;50:279–294. - PubMed
    1. Legro RS, Kunselman AR, Dodson WC, Dunaif A. Prevalence and predictors of risk for type 2 diabetes mellitus and impaired glucose tolerance in polycystic ovary syndrome: A prospective, controlled study in 254 affected women. J Clin Endocrinol Metab. 1999;84:165–169. - PubMed
    1. Ehrmann DA, Barnes RB, Rosenfield RL, Cavaghan MK, Imperial J. Prevalence of impaired glucose tolerance and diabetes in women with polycystic ovary syndrome. Diabetes Care. 1999;22:141–146. - PubMed
    1. Mannerås-Holm L, Benrick A, Stener-Victorin E. Gene expression in subcutaneous adipose tissue differs in women with polycystic ovary syndrome and controls matched pair-wise for age, body weight, and body mass index. Adipocyte. 2014;3:190–196. - PMC - PubMed

Publication types