. 2017 Aug 8;8(1):179.
doi: 10.1038/s41467-017-00071-z.

Formation and suppression of acoustic memories during human sleep

Affiliations

Formation and suppression of acoustic memories during human sleep

Thomas Andrillon et al. Nat Commun. .

Abstract

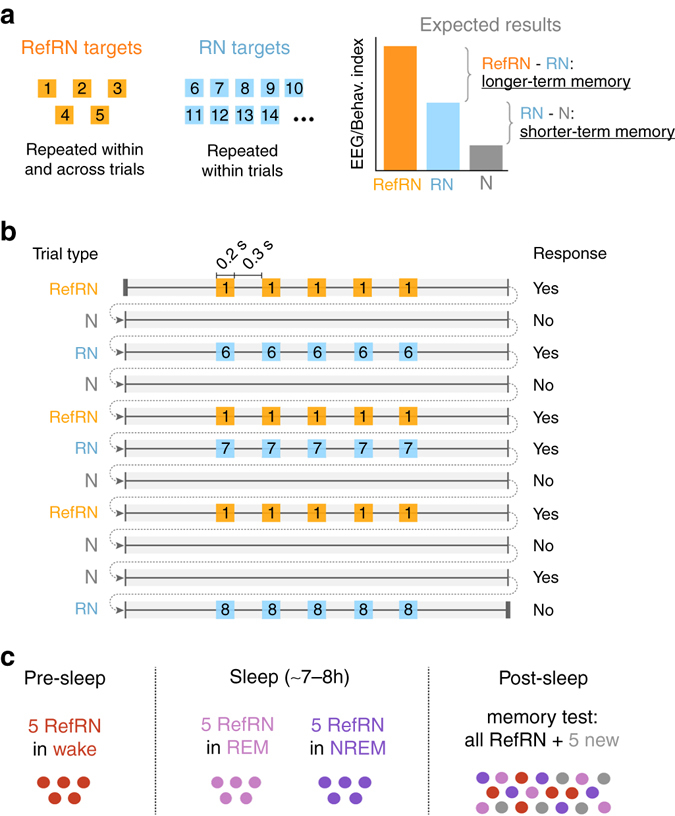
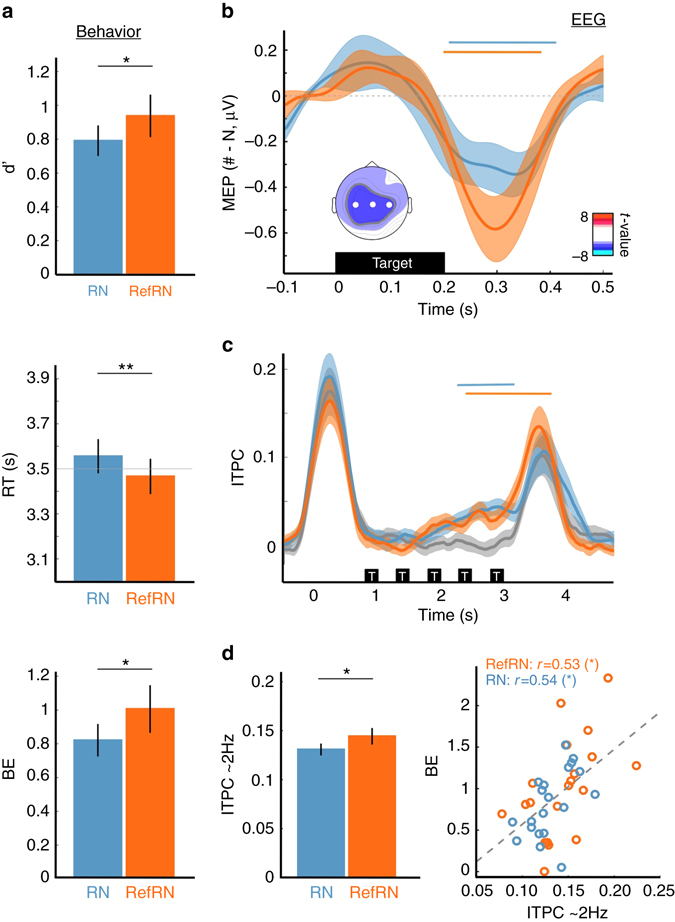
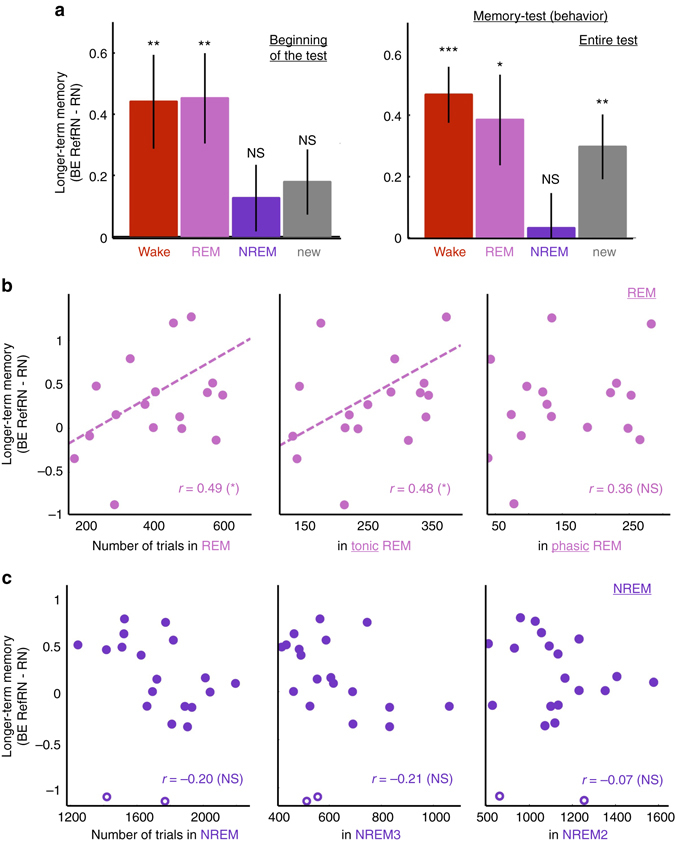
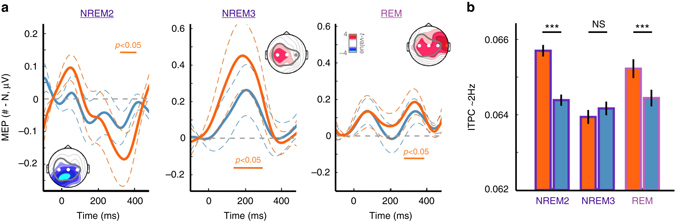
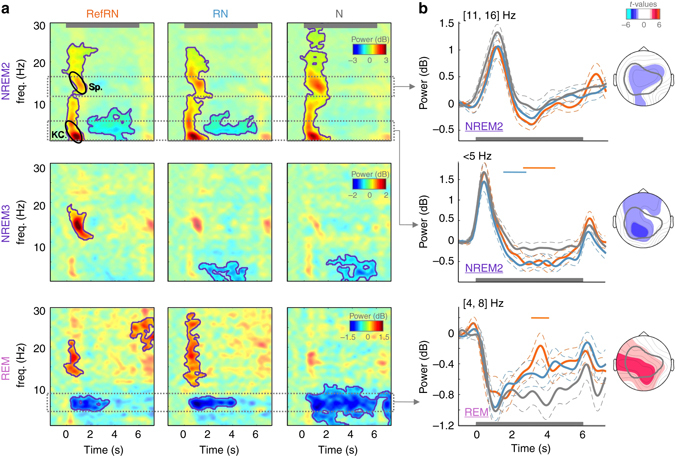
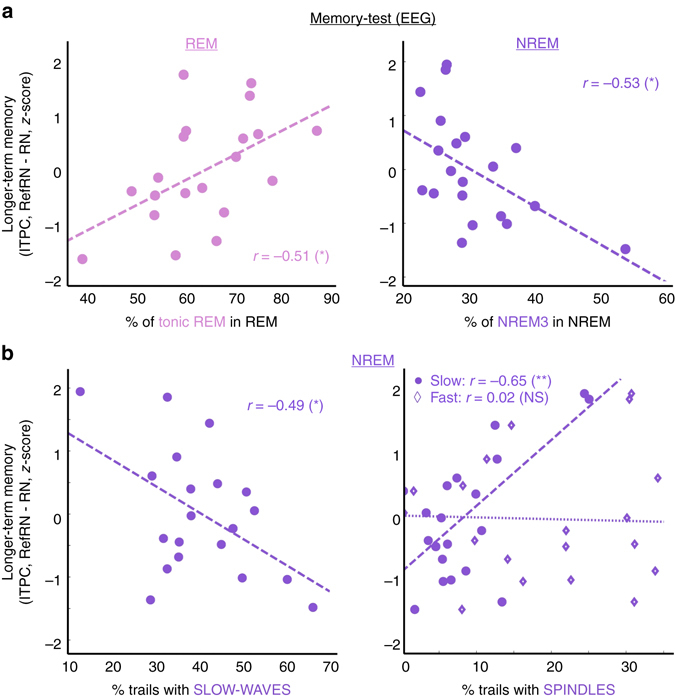
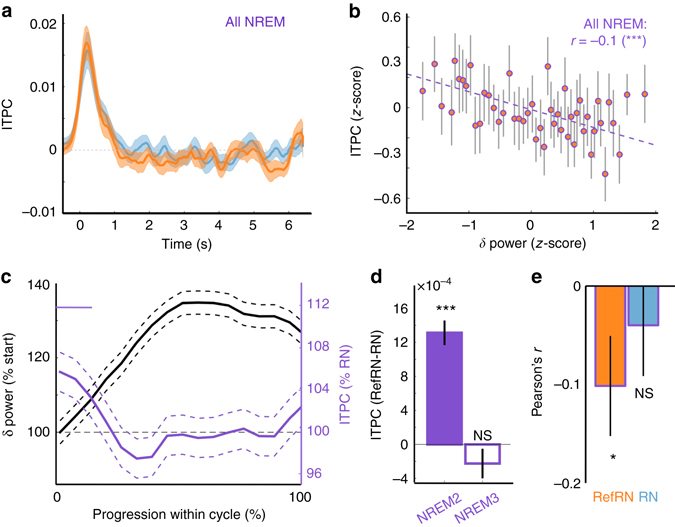
Sleep and memory are deeply related, but the nature of the neuroplastic processes induced by sleep remains unclear. Here, we report that memory traces can be both formed or suppressed during sleep, depending on sleep phase. We played samples of acoustic noise to sleeping human listeners. Repeated exposure to a novel noise during Rapid Eye Movements (REM) or light non-REM (NREM) sleep leads to improvements in behavioral performance upon awakening. Strikingly, the same exposure during deep NREM sleep leads to impaired performance upon awakening. Electroencephalographic markers of learning extracted during sleep confirm a dissociation between sleep facilitating memory formation (light NREM and REM sleep) and sleep suppressing learning (deep NREM sleep). We can trace these neural changes back to transient sleep events, such as spindles for memory facilitation and slow waves for suppression. Thus, highly selective memory processes are active during human sleep, with intertwined episodes of facilitative and suppressive plasticity.Though memory and sleep are related, it is still unclear whether new memories can be formed during sleep. Here, authors show that people could learn new sounds during REM or light non-REM sleep, but that learning was suppressed when sounds were played during deep NREM sleep.


Conflict of interest statement

The authors declare no competing financial interests.

Figures

Fig. 1
Fig. 1
Noise memory paradigm in wakefulness and sleep. a, b Stimuli and expected results: Participants (N = 20) were instructed to discriminate between trials made of running white noise (N) and trials that contained a repeated pattern (RN and RefRN), made by the seamless concatenation of short (0.2 s) noise segments (targets) interleaved with 0.3 s fresh white-noise fillers. RN (within-trial repetition) and RefRN (within- and across-trial repetition) trials had an identical structure and differed only regarding the amount of exposure to the target. Participants’ ability to discriminate RN from N trials evidences shorter-term memory for the novel repeated target. A better discrimination for RefRN compared to RN trials additionally indicates longer-term memory processes (a, right). c Full-night recording:. Each recording session started with a pre-sleep phase, during which participants were instructed to remain awake. In all, 5 unique randomly generated RefRN were used in the pre-sleep phase for each participant. In the sleep phase, participants were lying on a bed while being continuously exposed to white-noise stimuli. Different sets of unique RefRN targets were used depending on participants’ vigilance states (wake, non-rapid eye movement (NREM) and REM sleep). Finally, participants were tested upon awakening (post sleep) on all RefRN targets heard during the pre-sleep and sleep phases, along with 5 novel RefRNs (memory test). Each RefRN target was played in a separate block along new RN and N trials
Fig. 2
Fig. 2
Behavioral and electrophysiological indexes of perceptual learning in wakefulness. a Behavioral indexes of memory for noise. Participants could discriminate RN and RefRN from noise as indicated by the positive sensitivity (d′, top). In addition, performance was better for RefRN compared to RN: d′ was increased while reaction times (RTs, middle) were decreased for RefRN. We combined these two variables into a Behavioral Efficacy (BE, bottom) index. Error bars denote the standard error of the mean across participants (N = 20). Stars atop graphs refer to the RefRN vs. RN comparison (paired t-test, here and below: P < 0.01: **; P < 0.05: *). b Target-locked memory-evoked potentials (MEPs). Averaged EEG activity time-locked to the position of targets’ onset for RefRN (orange), RN (blue) compared to N trials during the pre-sleep phase. All targets but the first one from a given trial were used to compute these MEPs (4 targets per trial). MEPs were temporally smoothed using a 50 ms-wide Gaussian kernel. Shaded areas denote the SEM across participants. Horizontal orange and blue lines show significant clusters for the RefRN vs. N (orange, [200, 400] ms post target) and RN vs. N (blue, [200, 410] ms) comparisons (P cluster < 0.005). The inset shows the scalp topographies of t-values corresponding to the RefRN vs. N cluster (i.e., t-values obtained via a t-test of the RefRN vs. N difference for the MEPs waveforms averaged between 200 and 400 ms across participants). White dots show the central electrodes used in bd. c Stimulus-locked Inter-Trial Phase Coherence (ITPC). An increase in ITPC ([1.5, 3.5] Hz) was observed for RefRN ([2.3, 3.8]s post stimulus onset, P cluster < 0.05) and RN trials ([2.2, 3.1]s, P cluster < 0.05) compared to N. ITPC was here corrected for baseline activity ([−1.3, −0.3]s). d Averaging ITPC over the stimulus presentation window ([0.8, 3.8]s) revealed higher ITPC values for RefRN values compared to RN (two-tailed paired t-test). ITPC was correlated with BE (right, Pearson’s correlation)
Fig. 3
Fig. 3
Impact of prior exposure on behavioral performance upon awakening. a Behavioral efficacy indexes of longer-term memory (RefRN—RN) computed for the beginning (left, 3 first trials) or the entire (right) post-sleep blocks. BE was computed separately for the RefRN heard during wakefulness, REM, NREM, or for the novel RefRN introduced in the post-sleep phase. Error bars denote the standard error of the mean across participants (N = 20). Stars atop bars indicate the results of the statistical tests (t-tests against 0, P < 0.001: ***; P < 0.01: **; P < 0.05: *, NS: P ≥ 0.05). Performance is better for RefRN sounds heard during wake and REM sleep at the beginning of post-sleep blocks. For the whole test analysis, all conditions improve as participants could learn even new RefRNs during the block, with the notable exception of RefRN sounds heard during NREM sleep: those were not learnt even after the whole test. b Correlation between the REM sleep longer-term memory index (BERefRN—BERN) and the number of trials played in REM sleep (left), tonic REM sleep (middle), and phasic REM sleep (right) across participants. c Correlation between the NREM sleep longer-term memory index and the number of trials played in NREM sleep (NREM2 + NREM3, left), NREM3 (middle) and NREM2 (right) across participants. For b and c, Pearson’s correlation coefficients are displayed on each correlation plot (P < 0.05: *, NS: P ≥ 0.05). Open circles (c) show data points detected as outliers (see Methods). The correlation coefficients obtained when excluding these data points are presented in the Results section. Dotted lines show the linear fit for pairs of variables with significant correlation
Fig. 4
Fig. 4
Evoked activity to repeated noise snippets during sleep. a Target-locked memory-evoked potentials (MEPs) in NREM2 (left), NREM3 (middle), and REM (right) stages of sleep for RefRN (orange) or RN (blue) trials compared to N trials. Central electrodes were used (circles on scalp topographies) and all targets but the first one from a given trial were used (9 targets per trial). Note the resemblance between the NREM2 MEPs and the MEPs observed in wakefulness (Fig. 2b). Horizontal bars show significant clusters (NREM2: ([305, 405] ms; NREM3: ([130, 300] ms; REM: [280, 390] ms; P cluster < 0.05) for the RefRN vs. N difference (orange; no RN vs. N difference). Dotted lines denote the standard error of the mean across participants (N = 20). Insets: scalp distribution of t-values (RefRN vs. N, paired t-tests) over temporal windows corresponding to the abovementioned clusters. The gray contour shows the scalp distribution of the MEPs observed in wakefulness (Fig. 2b). MEPs were temporally smoothed using a 50 ms-wide Gaussian kernel. b Inter-trial phase coherency (ITPC) extracted over the entire night recordings (N = 20) on windows of 20 consecutive RefRN (orange bars) or RN (blue bars) trials. The corresponding windows were aggregated across participants (NREM2: N = 3698 and 3683; NREM3: N = 2480 and 2478; REM: N = 1190 and 1218 for RefRN and RN trials, respectively). ITPC was extracted around 2 Hz ([1.5, 3.5] Hz) and during stimulus presentation ([0.8, 5.5]s). Mixed-effects models revealed a significant interaction between sleep stages and stimulus condition (see Methods for details). Stars atop boxes indicate the results of post hoc statistical tests (t-tests against 0, P < 0.001: ***; P < 0.01: **; P < 0.05: *, NS: P ≥ 0.05). Note the significant increase in ITPC for RefRN compared to RN trials in stages NREM2 and REM but not in NREM3
Fig. 5
Fig. 5
Stimulus-dependent modulations of sleep rhythms. a Time–frequency decomposition of the EEG signal recorded on Cz in response to RefRN (left), RN (middle), and N (right) trials in NREM2 (top), NREM3 (middle), and REM (bottom) sleep stages. Power is time-locked to stimulus onsets, averaged across participants (N = 20) and expressed in dB compared to a pre-stimulus baseline ([−0.25, 0]s, see Methods). Magenta contours correspond to significant modulations compared to baseline activity (cluster permutation, P cluster < 0.05). Gray horizontal bar shows the stimulus presentation window. b Average activity in time–frequency bands typically associated to NREM (δ -power, < 5 Hz (corresponding to evoked KC: K-complexes,); σ-power, [11, 16] Hz (corresponding to Sp.: sleep spindles)) and REM rhythms (θ: [4, 8] Hz). The power responses were averaged over these frequency bands for NREM2 (top: σ, middle: δ) and REM sleep (bottom: θ). Between-condition differences are illustrated with colored horizontal bars (cluster-permutation test, P cluster < 0.05, orange: RefRN vs. N, blue: RN vs. N). Gray horizontal bar shows the stimulus presentation window and dotted lines denote the standard error of the mean computed across participants (N = 20). When comparing RefRN and N trials, NREM2 was characterized by a decrease in δ power, REM by an increase in θ power for RefRN trials. Note the tendency for a decrease in power in the σ band for RefRN compared to N trials, although such a decrease did not resist the cluster permutation (no cluster with P cluster < 0.05). The scalp distribution of the t-values of the RefRN vs. N comparison when averaging the power in the corresponding frequency band and over a [0.8, 5.5] s window is displayed on the side. The gray contour shows the scalp distribution of the MEPs observed in wakefulness (Fig. 2b). Note the overlap between the scalp distributions of the effects observed in sleep
Fig. 6
Fig. 6
Impact of prior exposure and sleep rhythms on phase coherence upon awakening. EEG index (Inter-Trial Phase Coherence, ITPC) quantifying longer-term memory (ITPCRefRN—ITPCRN) for RefRN sounds heard during REM and NREM sleep, computed over the whole post-sleep blocks. a Left: Correlation between the magnitude of the REM sleep EEG index (z-scored across participants) and the proportion of trials in tonic REM sleep. Right: Correlation between the magnitude of the NREM sleep EEG index and the proportion of NREM3 trials within NREM sleep. As for the behavioral index (Fig. 3b), there was a positive correlation between REM sleep learning and the prevalence of tonic REM sleep. There was also a negative correlation between the marker of learning for the NREM list and the prevalence of NREM3 sleep. b Correlation between the magnitude of the EEG index (z-scored across participants) for the RefRN heard in NREM and the proportion of trials containing slow waves (left) or sleep spindles (right; circles: slow spindles; diamonds: fast spindles). Note the negative correlation between the EEG learning index and the proportion of trials associated to slow waves on one hand and the positive correlation with the proportion of trials associated with slow spindles on the other hand. Pearson’s correlation coefficients are displayed on each correlation plot (P < 0.01: **P < 0.05: *P ≥ 0.05, NS) and dotted lines show the linear fit between the pairs of variables
Fig. 7
Fig. 7
The learning index is dynamically correlated with slow-wave power in NREM sleep. a Inter-trial phase coherence (ITPC) extracted around 2 Hz ([1.5, 3.5]Hz) locked to stimulus onset for RefRN (orange curve) and RN (blue curve) trials in NREM sleep (NREM2 and NREM3). ITPC was corrected by the baseline ITPC ([−1.3, 0.3]s). b Correlation between ITPC values computed for RefRN trials (z-scored per sleep-cycle to highlight the within-cycle dynamics, see Methods) and δ (<5 Hz) power (N = 1368 data points in 82 cycles and 18 participants). Data was binned for illustrative purpose (N = 50 bins) and each dot represents a bin. Error bars represent the standard error of the mean (SEM) of ITPC values for each bin. Mixed-effects models revealed a significant influence of δ -power on ITPC (see Methods) quantified here with a Pearson’s correlation coefficient (***P < 0.001) as well as the regression line between the two variables, both estimated on unbinned data. c Evolution of longer-term memory index (ITPC, RefRN over RN ratio) and δ -power within sleep cycles. Cycle durations were normalized and expressed as a percentage of total duration. δ -power was also normalized (100% = beginning of cycle). Dotted curves denote the SEM across sleep cycles (N = 82 in 18 participants). Note the perceptual learning (RefRN>RN, P cluster<0.05) at the beginning of sleep cycles (typically light NREM). This advantage disappeared with the increase in δ -power. d Difference in ITPC between RefRN and RN (longer-term memory index) in NREM2 and NREM3 (all sleep recordings aggregated: N = 3698 and 2480 data points for NREM2 and NREM3, respectively, in 20 participants). The number of data points being different for RefRN and RN trials, the mean ITPC value for RN trials was subtracted to the ITPC for RefRN (unpaired subtraction). Mixed-effects models revealed a significant interaction between sleep stages and stimulus condition (χ 2(5) = 432.0, P < 2.2 × 10−16, see Methods). Stars show post hoc statistical tests comparing ITPC for RefRN and RN trials in NREM2 (two-tailed t-tests: ***P < 0.001) and NREM3 (NS: P≥0.05). e Pearson’s correlation coefficients between ITPC and δ -power for RefRN (orange) and RN (blue), respectively, computed on each cycle separately and averaged here across sleep cycles (n = 82 cycles). Pearson’s coefficients were significantly negative for RefRN (two-tailed t-test, t(81) = −2.24, P = 0.028, Hedges’ g = 0.25) but not for RN trials (t(81 = −0.50, P = 0.62, Hedges’ g = 0.06)

References

    1. Simon CW, Emmons WH. Learning during sleep? Psychol. Bull. 1955;52:328–342. doi: 10.1037/h0043733. - DOI - PubMed
    1. Beh HC, Barratt PE. Discrimination and conditioning during sleep as indicated by the electroencephalogram. Science. 1965;147:1470–1. doi: 10.1126/science.147.3664.1470. - DOI - PubMed
    1. Fifer WP, et al. Newborn infants learn during sleep. Proc. Natl Acad. Sci. USA. 2010;107:10320–10323. doi: 10.1073/pnas.1005061107. - DOI - PMC - PubMed
    1. Ikeda K, Morotomi T. Classical conditioning during human NREM sleep and response transfer to wakefulness. Sleep. 1996;19:72–74. doi: 10.1093/sleep/19.1.72. - DOI - PubMed
    1. Maho C, Hennevin E. Appetitive conditioning-induced plasticity is expressed during paradoxical sleep in the medial geniculate, but not in the lateral amygdala. Behav. Neurosci. 2002;116:807–823. doi: 10.1037/0735-7044.116.5.807. - DOI - PubMed

Publication types