. 2017 Aug 8;7(1):7529.
doi: 10.1038/s41598-017-07660-4.

Preventing inflammation inhibits biopsy-mediated changes in tumor cell behavior

Affiliations

Preventing inflammation inhibits biopsy-mediated changes in tumor cell behavior

Maria Alieva et al. Sci Rep. .

Abstract

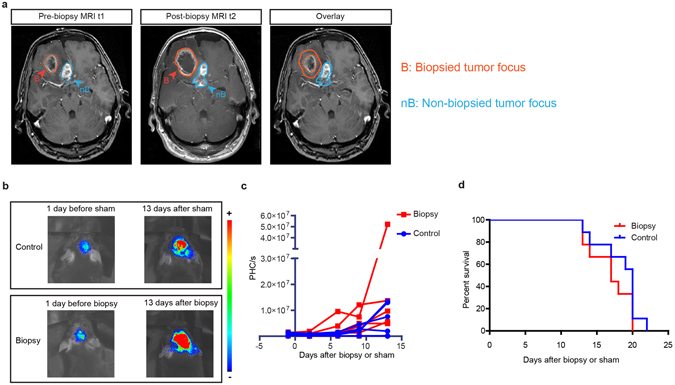
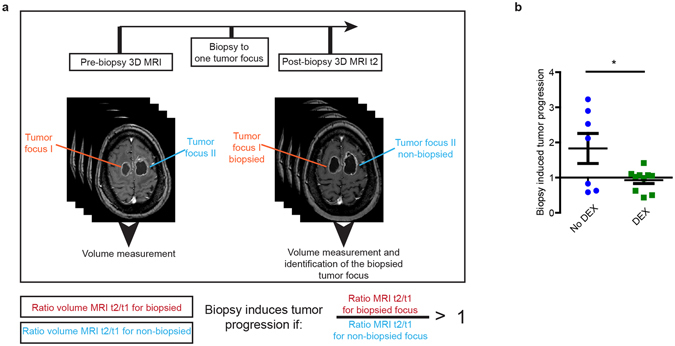
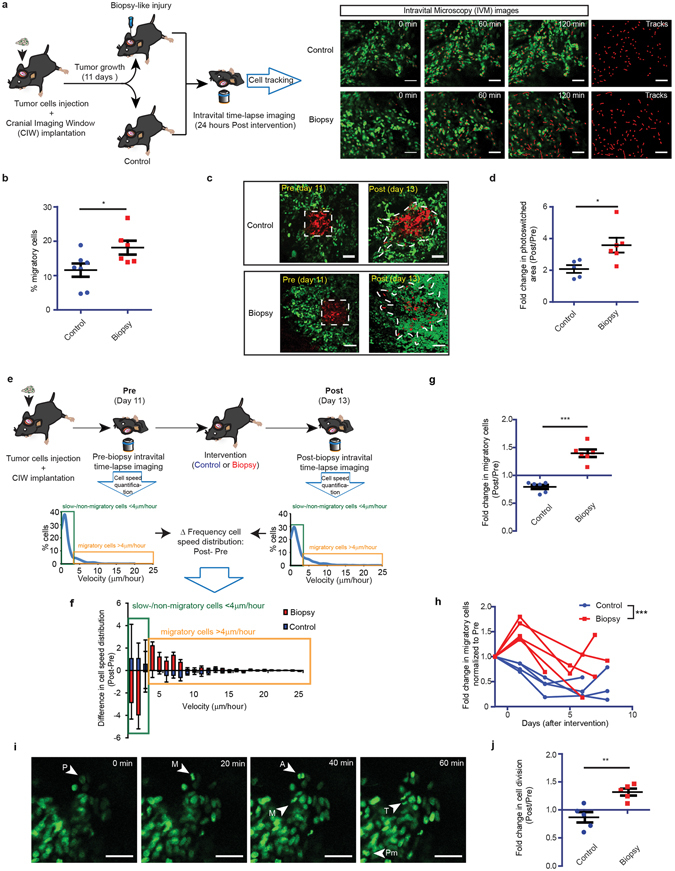
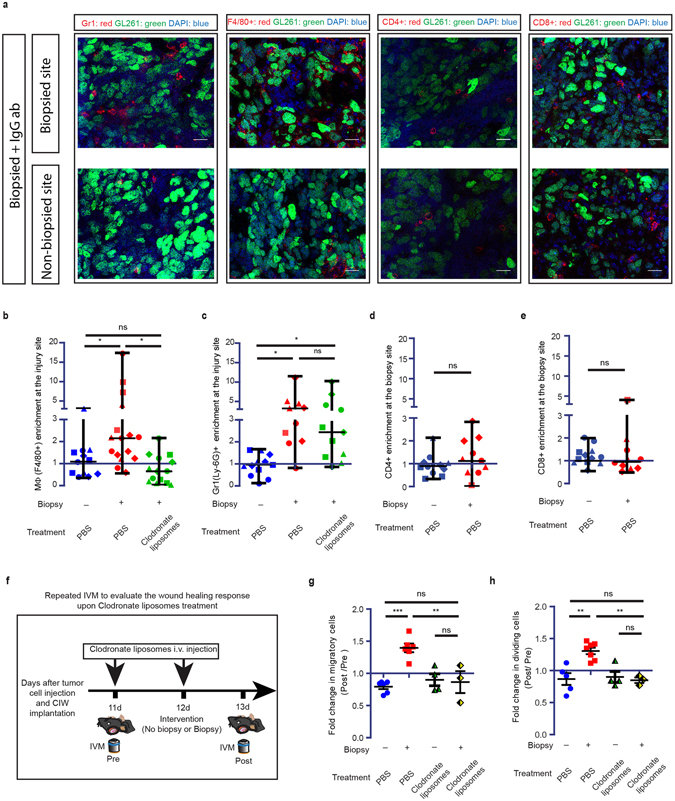
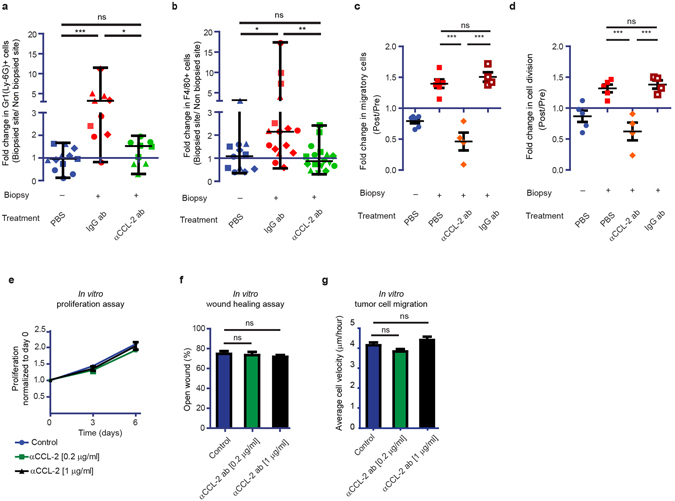
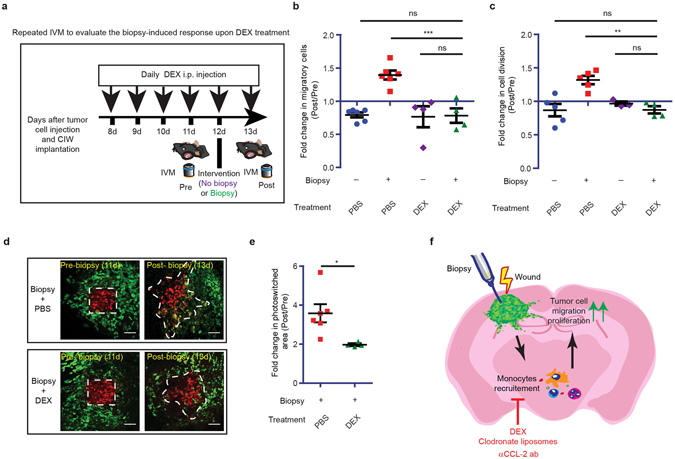
Although biopsies and tumor resection are prognostically beneficial for glioblastomas (GBM), potential negative effects have also been suggested. Here, using retrospective study of patients and intravital imaging of mice, we identify some of these negative aspects, including stimulation of proliferation and migration of non-resected tumor cells, and provide a strategy to prevent these adverse effects. By repeated high-resolution intravital microscopy, we show that biopsy-like injury in GBM induces migration and proliferation of tumor cells through chemokine (C-C motif) ligand 2 (CCL-2)-dependent recruitment of macrophages. Blocking macrophage recruitment or administrating dexamethasone, a commonly used glucocorticoid to prevent brain edema in GBM patients, suppressed the observed inflammatory response and subsequent tumor growth upon biopsy both in mice and in multifocal GBM patients. Taken together, our study suggests that inhibiting CCL-2-dependent recruitment of macrophages may further increase the clinical benefits from surgical and biopsy procedures.


Conflict of interest statement

The authors declare that they have no competing interests.

Figures

Figure 1
Figure 1
Effect of biopsy on glioma progression. (a) Representative slices of MR images taken before (left panel) and after biopsy (middle panel) showing the progression of the biopsied and non-biopsied tumors (right panel). (b) Representative images showing glioma progression in control and biopsied tumors monitored by bioluminescence. (c) Kinetics of glioma growth per individual mice. Each dot represents the photon counts per second (PHC/s) values from individual mice, values from the same mouse are connected with a line (n = 9). (d) Kaplan-Meier survival curves of mice that received a biopsy-like injury or control mice.
Figure 2
Figure 2
DEX treatment blocks biopsy-induced tumor progression in patients with multifocal GBM. (a) Cartoon showing MRI analysis setup. (b) The normalized tumor progression of biopsied tumor in patients that did not receive DEX before biopsy (blue circles) and patients that receive DEX before biopsy (green squares). Every symbol represents the mean of an individual patient. (n >= 7 per condition, *P < 0.05 versus control, Student’s t test).
Figure 3
Figure 3
Change in tumor migratory and proliferative behavior upon biopsy revealed by repeated intravital imaging. (a) A schematic overview of the setup of the experiment. IVM images of biopsied and control GL261 H2B-Dendra2 tumors. Red lines highlight individual tumor cell tracks. Scale bar represents 50 µm. (b) Quantification of percentage of migratory tumor cells, where each dot represents the mean value of an individual mouse. (n >= 6 mice, *P < 0.05 versus control, Student’s t test) (c) Representative H2B-Dendra2 images of tumor cell migration and infiltration. The white dotted line represents the migration and infiltration area. Scale bar represents 50 µm. (d) The increased photoconverted area plotted for the indicated conditions. Every dot represents the mean value of an individual mouse. (n >= 5 mice *P < 0.05 versus control, Student’s t test). (e) Cartoon showing experimental design. The waterfall plots are calculated by subtracting the cell velocity distribution pre-intervention from the cell velocity distribution post-intervention. (f) Waterfall plots showing the change in cell velocity distribution relative to basal migration in individual mice. The data is shown as mean ± S.E.M. of 5 mice. (g) The number of migratory cells in control (blue) and biopsy (red) animals normalized to the pre-intervention values. (n = 6 mice ***P < 0.0001 versus control, Student’s t test). (h) The normalized (relative to pre-intervention) number of migratory cells in individual mice over time. (n >= 4 mice per condition, ***P < 0.0001 versus control, two-way ANOVA). (i) Representative in vivo time-lapse images showing dividing cells in GL261 H2B-Dendra2 tumors. Different stages of mitosis are indicated: prophase (P), prometaphase (Pm), metaphase (M), anaphase (A), telophase (T). Scale bar represents 50 μm. (j) The normalized number of dividing cells in control (blue) and biopsy (red) animals. Per individual animal, the values Post intervention were normalized to the values Pre. (n = 5 mice, **P < 0.01 versus control, Student’s t test).
Figure 4
Figure 4
Monocyte recruitment is required for biopsy-induced tumor progression. (a) Representative staining showing Gr-1 (Ly-6G) + neutrophils; F4/80 + macrophages/microglia; CD4 + lymphocytes; CD8 + lymphocytes at biopsied and non-biopsied sites of mice that were injected with a random IgG antibody assessed by confocal microscopy. Shown are immune cell stainings in red, H2B-Dendra2 GL261 expression in green and DAPI staining in blue. Scale bar represents 20 μm. (b–e) Normalized number of F4/80 + (b) and Gr-1 (Ly-6G) + (c), cells in control, biopsied and biopsied + clodronate liposomes groups. Normalized number of CD4 + (d) and CD8 + (e), cells in control and biopsied groups. Per slide, the values of immune cells/area at the biopsied site were normalized to the values outside the biopsied site. Symbols represent different mice. P value was calculated using non-parametric t test. (n >= 3 per condition, **P < 0.01, one-way ANOVA with Newman-Keuls’s post hoc test). (f) Cartoon showing experimental design to evaluate the biopsy-induced response upon monocytes depletion. (g,h) The normalized number of migratory (g) and dividing (h) cells in control; biopsy and biopsy + clodronate liposomes groups. Per individual animal, the values Post intervention were normalized to the values Pre. (n >= 3 mice per condition, **P < 0.01, ***p < 0.001, one-way ANOVA with Newman-Keuls’s post hoc test).
Figure 5
Figure 5
CCL-2 inhibition blocks biopsy-induced tumor progression. (a,b) Normalized number of Gr-1 (Ly-6G) + (a) and F4/80 + (b) cells in control; biopsy + IgG antibody; and biopsy + αCCL-2 antibody animals. Per slide, the values of immune cells/area at the biopsied site were normalized to the values outside the biopsied site. Symbols represent different mice. P value was calculated using non-parametric t test. n >= 3 per condition. (c,d) The normalized number of migratory (c) and dividing (d) cells in control; biopsy; biopsy + αCCL-2 antibody; and biopsy + IgG antibody animals. Per individual animal, the values Post intervention were normalized to the values Pre. n >= 4 mice per condition. ***P < 0.0001, one-way ANOVA with Newman-Keuls’s post hoc test. (e) In vitro cell proliferation of GL261 cells cultured with PBS or αCCL-2 antibody. Data is based on triplicates. (f) In vitro GL261 invasion measured by scratch assay of cells cultured with PBS or αCCL-2 antibody. Data is based on triplicates. (g) Graph showing the average velocity of individual GL261 cells tracked in vitro, cultured with PBS or αCCL-2 antibody. Data is based on triplicates.
Figure 6
Figure 6
Biopsy-induced response is inhibited by DEX treatment. (a) Cartoon showing experimental design to evaluate the biopsy-induced response upon DEX treatment. (b) The increase in the number of migratory cells for the indicated conditions. Every symbol represents the mean of an individual mouse, and n >= 4 per condition. (c) The increase in the number of dividing cells for the indicated conditions. Every symbol represents the mean of an individual mouse, and n >= 3 per condition., **P < 0.01,***P < 0.001 one-way ANOVA with Newman-Keuls’s post hoc test. (d) The increased photoconverted area plotted for the indicated conditions. Every dot represents the mean value of an individual mouse. Scale bar represents 50 µm. (e) Quantification of increase in migration and infiltration area for the indicated conditions. The data is shown as mean ± S.E.M. n >= 4 mice, *P < 0.05 versus PBS group, Student’s t test. (f) Schematic illustration of a model showing how biopsy induces tumor cell migration and proliferation.

References

    1. Heuckmann JM, Thomas RK. A new generation of cancer genome diagnostics for routine clinical use: overcoming the roadblocks to personalized cancer medicine. Annals of oncology: official journal of the European Society for Medical Oncology/ESMO. 2015;26:1830–1837. doi: 10.1093/annonc/mdv184. - DOI - PubMed
    1. Tomlins SA, Palanisamy N, Siddiqui J, Chinnaiyan AM, Kunju LP. Antibody-based detection of ERG rearrangements in prostate core biopsies, including diagnostically challenging cases: ERG staining in prostate core biopsies. Archives of pathology & laboratory medicine. 2012;136:935–946. doi: 10.5858/arpa.2011-0424-OA. - DOI - PMC - PubMed
    1. van Malenstein H, et al. Histology obtained by needle biopsy gives additional information on the prognosis of hepatocellular carcinoma. Hepatology research: the official journal of the Japan Society of Hepatology. 2012;42:990–998. doi: 10.1111/j.1872-034X.2012.01010.x. - DOI - PubMed
    1. Predina J, et al. Changes in the local tumor microenvironment in recurrent cancers may explain the failure of vaccines after surgery. Proceedings of the National Academy of Sciences of the United States of America. 2013;110:E415–424. doi: 10.1073/pnas.1211850110. - DOI - PMC - PubMed
    1. Lange PH, Hekmat K, Bosl G, Kennedy BJ, Fraley EE. Acclerated growth of testicular cancer after cytoreductive surgery. Cancer. 1980;45:1498–1506. doi: 10.1002/1097-0142(19800315)45:6<1498::AID-CNCR2820450633>3.0.CO;2-7. - DOI - PubMed

Publication types

MeSH terms