. 2017 Aug 8;7(1):7610.
doi: 10.1038/s41598-017-06650-w.

Unraveling heme detoxification in the malaria parasite by in situ correlative X-ray fluorescence microscopy and soft X-ray tomography

Affiliations

Unraveling heme detoxification in the malaria parasite by in situ correlative X-ray fluorescence microscopy and soft X-ray tomography

Sergey Kapishnikov et al. Sci Rep. .

Abstract

A key drug target for malaria has been the detoxification pathway of the iron-containing molecule heme, which is the toxic byproduct of hemoglobin digestion. The cornerstone of heme detoxification is its sequestration into hemozoin crystals, but how this occurs remains uncertain. We report new results of in vivo rate of heme crystallization in the malaria parasite, based on a new technique to measure element-specific concentrations at defined locations in cell ultrastructure. Specifically, a high resolution correlative combination of cryo soft X-ray tomography has been developed to obtain 3D parasite ultrastructure with cryo X-ray fluorescence microscopy to measure heme concentrations. Our results are consistent with a model for crystallization via the heme detoxification protein. Our measurements also demonstrate the presence of considerable amounts of non-crystalline heme in the digestive vacuole, which we show is most likely contained in hemoglobin. These results suggest a tight coupling between hemoglobin digestion and heme crystallization, highlighting a new link in the crystallization pathway for drug development.


Conflict of interest statement

The authors declare that they have no competing interests.

Figures

Figure 1
Figure 1
(A) Schematic view of soft X-ray tomography setup. (B) Schematic view of scanning X-ray fluorescence setup. (C) Non-aligned soft X-ray tomography image of a red blood cell (red arrow) infected with two malaria parasites (green arrows). (D) Non-aligned X-ray iron fluorescence map of the same cell obtained by raster scanning in X-ray fluorescence microscopy.
Figure 2
Figure 2
Correlative imaging of Plasmodium parasites by soft X-ray tomography (SXT) and scanning X-ray fluorescence (XRF). Shown are average intensity projections of four different soft X-ray tomography images (1st column). Seven different parasites are visible (green arrows, dots and numbers) within four infected red blood cells (iRBCs) and red arrowheads). The digestive vacuole within the parasite (DV, white dots and arrowheads) can also be discerned, although precise determination of the DV boundary requires contrast adjustment of the images (Supplementary Fig. 1). Hemozoin crystals (Hz and orange arrowheads) are also visible as dark-grey spots due to strong X-ray absorption by their densely packed carbon content and iron. This high absorption enables clear detection of the crystals by computing a minimum projection of the 3D SXT images (2nd column). We transferred these four iRBCs to the scanning XRF microscope and then collected images of iron fluorescence (3rd column). Alignment of the SXT and XRF images was performed using the axial/in-plane alignment procedure described in the Results and Methods. This enabled transfer of the green and white dots indicating parasite and DV boundaries obtained from the SXT images to the fluorescence images. Finally, we generated overlays of the fluorescence and SXT minimum projection images (4th column). Note that in these overlay images (4th column) high iron fluorescence consistently overlays the Hz crystals detected by SXT. Note also that some background fluorescence can also be observed in the RBC cytosol surrounding the parasites (region between the white and the edge of the iRBC in C,G,K). This probably reflects undigested hemoglobin in the parasite. Consistent with this, very strong iron fluorescence within the DV correlates with very low iron fluorescence in RBC cytosol (O), suggesting that this parasite is at a later stage where most of the hemoglobin has already been digested and the heme converted into hemozoin crystals. Scale bar 2 μm.
Figure 3
Figure 3
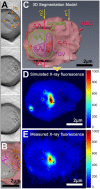
Alignment procedure by 3D segmentation and fluorescence modeling. Shown are selected Z slices from the SXT 3D reconstruction of parasite 8 and its red blood cell (A). Each slice in the 3D SXT image is hand segmented to identify the domains of key sub-structures, namely, the red blood cell (magenta), parasite (light green), digestive vacuole (purple) and hemozoin crystals (red) (B). The final 3D segmentation can then be used to predict the iron fluorescence obtained from an XRF scan, which produces a 2D projection of the iron levels in the red blood cell and parasite volume. Selected X-ray fluorescence paths (xr1 and xr2) through the specimen are shown (C). These traverse different domains of the specimen, which are of different thickness (h) and which contain different iron concentrations (c). Each domain therefore produces absorption proportional to the product ch, and the sum of these along any path is the predicted absorption in the XRF image. By assigning known iron concentrations to selected compartments, a predicted fluorescent image can therefore be generated (D, see Supplementary Information for a detailed explanation and calculation). The measured fluorescence image (E) can then be morphed onto the simulated fluorescence image, which will account for any random drift of the XRF stage during the measurement. In this way, the morphed XRF image can be overlaid onto the segmented 3D image to back calculate the amount of iron in the hemozoin crystals and the non-crystalline heme elsewhere in the digestive vacuole.
Figure 4
Figure 4
Infected red blood cell (parasite 8 in Table 1) imaged by soft X-ray tomography and scanning iron X-ray fluorescence and subject to alignment by 3D segmentation and fluorescent modeling as described in the Results and Methods. (A) Soft X-ray tomography projection image of the infected cell. The dotted lines delineate the parasite (green), its digestive vacuole (black-on-white), and the area of the digestive vacuole free from hemozoin fluorescence signal (magenta). Some of the hemozoin crystals are indicated by orange arrows. (B) Iron x-ray fluorescence map of the same cell aligned to its x-ray tomography dataset.
Figure 5
Figure 5
Hemozoin iron content as a function of the parasite age in parasites 1–8. Blue circles are the measured values taken from Table 1, and the green line is the fit with equal weights. The slope of the best fitting line yields the estimated rate of in vivo crystallization, and the x intercept the estimated onset time for heme crystallization.
Figure 6
Figure 6
Measured X-ray linear absorption coefficients within the parasitic digestive vacuole, derived from the grey scale intensity contrast of the SXT data. (A) Absorption coefficient distribution in the digestive vacuole (DV) measured in a tomographic slice in the XY plane, which is parallel to the zero-tilt SXT projection, perpendicular to the optical axis Z and in a plane similar to that of the Fe fluorescence map. (B) Measurement in the XZ plane, which is parallel to the optical axis and perpendicular to the XY plane. Insets: corresponding grey scale images of the tomographic slices in the XY and XZ planes. The absorption coefficients are derived from the pixels within the digestive vacuole (DV). The histograms peak at 0.28 and 0.24 μm−1, and the mean of these values and the mean of their standard deviations yield 0.26 ± 0.14 μm−1. (C) This measured absorption is then compared to the predicted absorption for hemoglobin in the digestive vacuole, as would be required to store the 13 mM heme predicted from XRF measurements.
Figure 7
Figure 7
Assembly line model for hemozoin (Hz) crystal formation in the digestive vacuole of a RBC infected by the malaria parasite P. falciparum, in the trophozoite stage. Our measurements show that in vivo heme crystallization occurs at a rate of ~104 s−1 (brown arrow). This rate is close to the in vitro rate of heme dimerization measured for the heme detoxification protein (HDP), and so we propose that HDP is primarily responsible for heme crystallization. Our measurements also show that there is considerable non-crystalline heme in the digestive vacuole and that this heme is most likely contained within hemoglobin (small red sphere at top). Thus in order to avoid overproduction of heme monomers and dimers, hemoglobin digestion and heme dimerization must proceed at a rate (green arrow) equal to the rate of heme crystallization. As a result, we propose a feedback mechanism (blue arrow) between crystallization and proteolysis to control the rates of proteolysis. We propose that the heme dimers produced by HDP either bind to existing hemozoin crystals or form new crystals via heterogeneous nucleation in an aqueous environment at the inner leaflet of the digestive vacuole membrane, . With each hemoglobin molecule containing four heme monomers the rate of globin degradation (grey arrow) is ¼ that of heme monomer release.

References

    1. Pagola S, Stephens WP, Bohle DS, Kosar AD, Madsen SK. The structure of malaria pigment β-haematin. Nature. 2000;404:307–310. doi: 10.1038/35005132. - DOI - PubMed
    1. Jani D, et al. HDP–A Novel Heme Detoxification Protein from the Malaria Parasite. PLoS Pathog. 2008;4:e1000053. doi: 10.1371/journal.ppat.1000053. - DOI - PMC - PubMed
    1. Weissbuch I, Leiserowitz L. Interplay Between Malaria, Crystalline Hemozoin Formation, and Antimalarial Drug Action and Design. Chemical Reviews. 2008;108:4899–4914. doi: 10.1021/cr078274t. - DOI - PubMed
    1. Toh SQ, Glanfield A, Gobert GN, Jones MK. Heme and blood-feeding parasites: friends or foes? Parasites & Vectors. 2010;3:10. doi: 10.1186/1756-3305-3-108. - DOI - PMC - PubMed
    1. Slavic K, et al. A vacuolar iron-transporter homologue acts as a detoxifier in Plasmodium. Nat Commun. 2016;7:10403. doi: 10.1038/ncomms10403. - DOI - PMC - PubMed

Publication types

MeSH terms