. 2017 Jul 25:11:380.
doi: 10.3389/fnhum.2017.00380. eCollection 2017.

Multi-Kernel Learning with Dartel Improves Combined MRI-PET Classification of Alzheimer's Disease in AIBL Data: Group and Individual Analyses

Affiliations

Multi-Kernel Learning with Dartel Improves Combined MRI-PET Classification of Alzheimer's Disease in AIBL Data: Group and Individual Analyses

Vahab Youssofzadeh et al. Front Hum Neurosci. .

Erratum in

Abstract

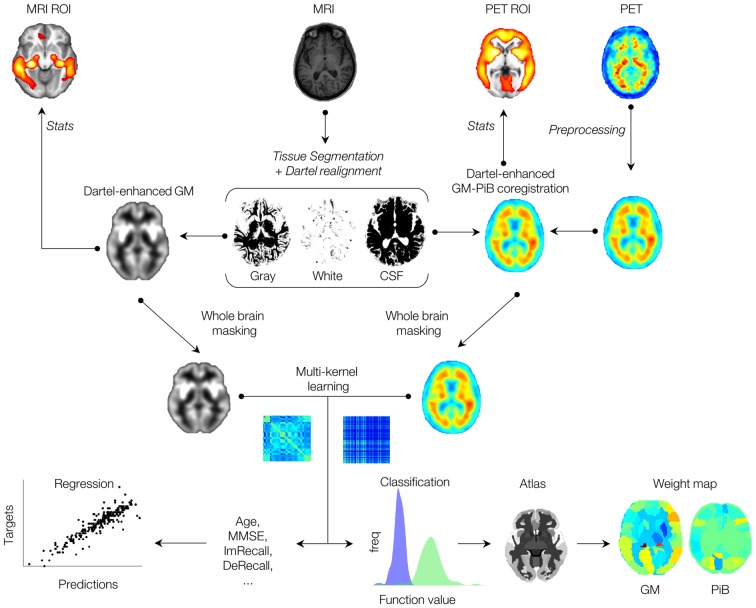
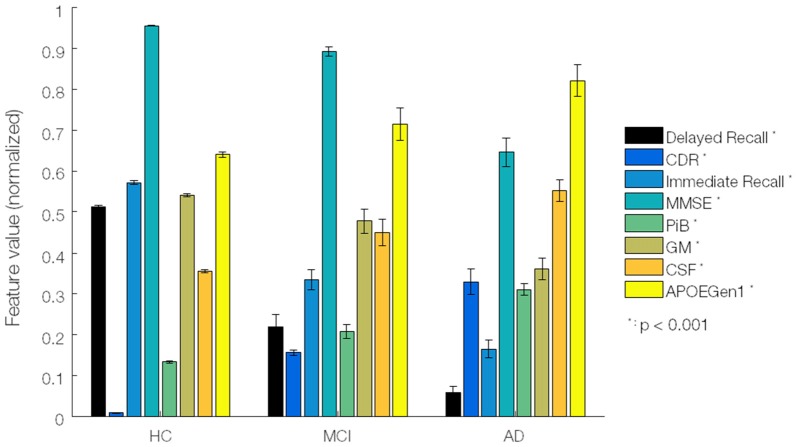
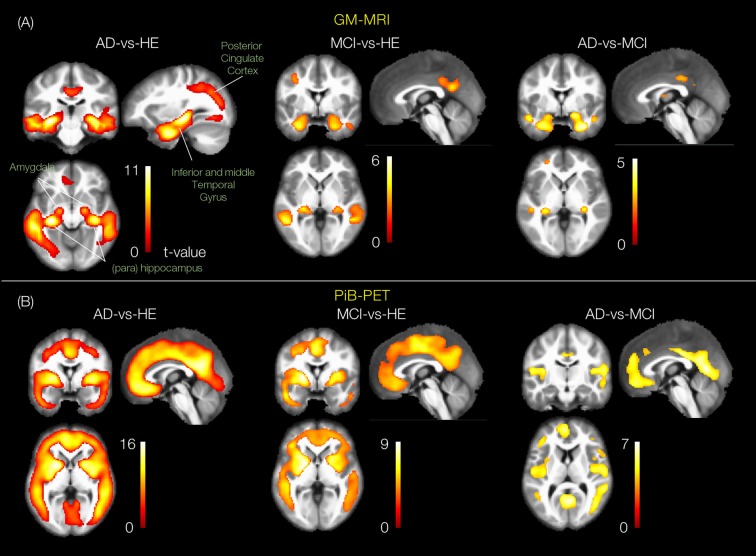
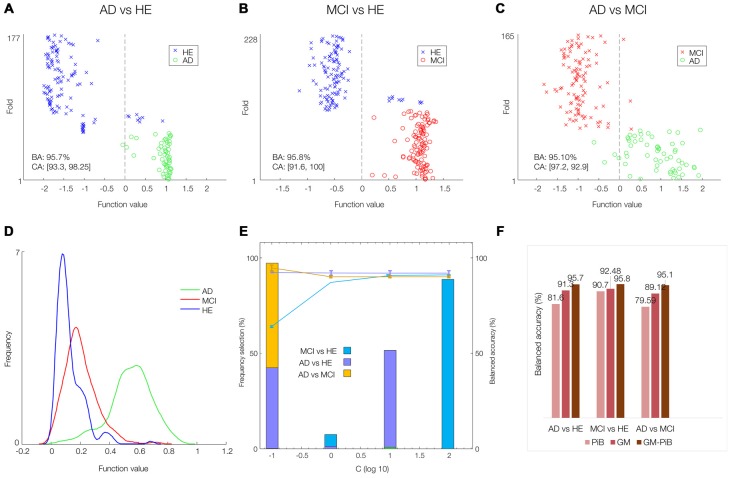
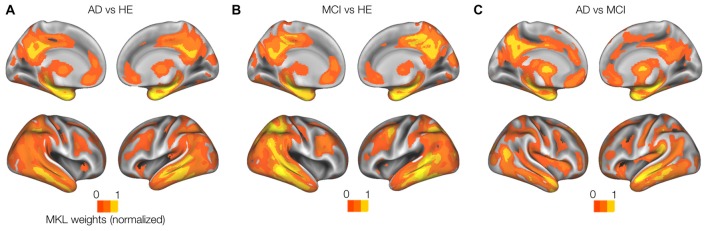
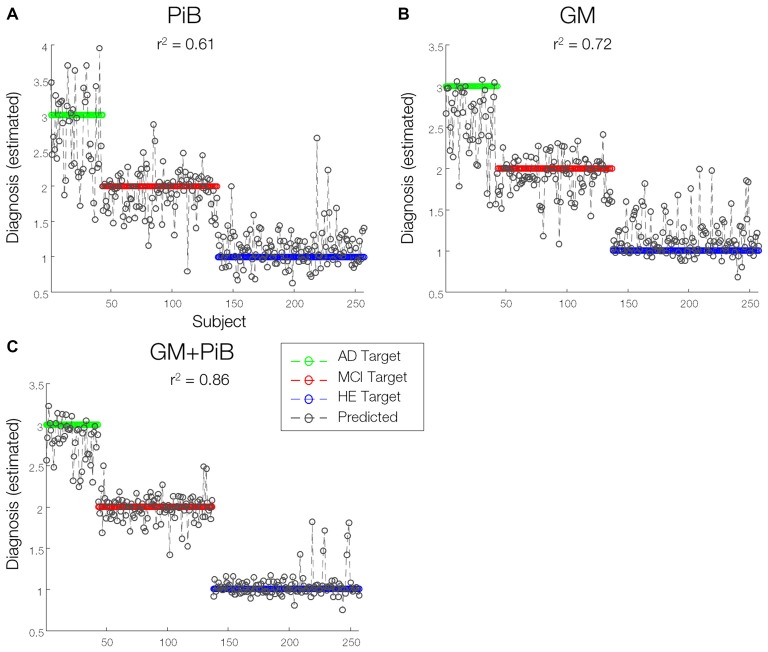
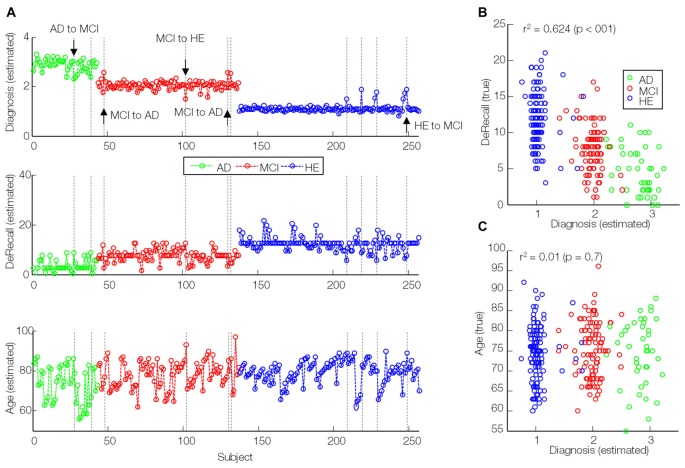
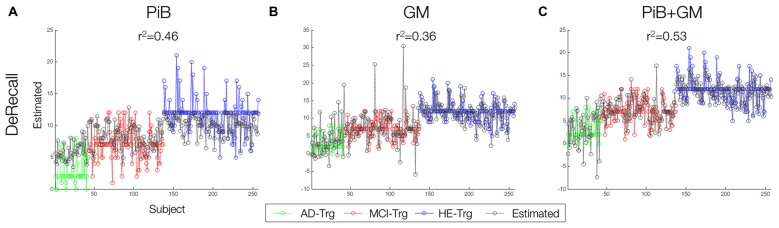
Magnetic resonance imaging (MRI) and positron emission tomography (PET) are neuroimaging modalities typically used for evaluating brain changes in Alzheimer's disease (AD). Due to their complementary nature, their combination can provide more accurate AD diagnosis or prognosis. In this work, we apply a multi-modal imaging machine-learning framework to enhance AD classification and prediction of diagnosis of subject-matched gray matter MRI and Pittsburgh compound B (PiB)-PET data related to 58 AD, 108 mild cognitive impairment (MCI) and 120 healthy elderly (HE) subjects from the Australian imaging, biomarkers and lifestyle (AIBL) dataset. Specifically, we combined a Dartel algorithm to enhance anatomical registration with multi-kernel learning (MKL) technique, yielding an average of >95% accuracy for three binary classification problems: AD-vs.-HE, MCI-vs.-HE and AD-vs.-MCI, a considerable improvement from individual modality approach. Consistent with t-contrasts, the MKL weight maps revealed known brain regions associated with AD, i.e., (para)hippocampus, posterior cingulate cortex and bilateral temporal gyrus. Importantly, MKL regression analysis provided excellent predictions of diagnosis of individuals by r2 = 0.86. In addition, we found significant correlations between the MKL classification and delayed memory recall scores with r2 = 0.62 (p < 0.01). Interestingly, outliers in the regression model for diagnosis were mainly converter samples with a higher likelihood of converting to the inclined diagnostic category. Overall, our work demonstrates the successful application of MKL with Dartel on combined neuromarkers from different neuroimaging modalities in the AIBL data. This lends further support in favor of machine learning approach in improving the diagnosis and risk prediction of AD.

Keywords: Alzheimer’s disease; Australian imaging; biomarkers; classification; lifestyle AIBL; machine learning; multi-kernel learning; prediction.


Figures

Figure 1
Figure 1
Schematic overview of the proposed multimodal (imaging) machine-learning framework. See text for detailed descriptions.
Figure 2
Figure 2
Significant data features ranked by ANOVA test. A total of 8 out of 33 features were identified by ANOVA test from 58 Alzheimer’s disease (AD), 108 mild cognitive impairment (MCI) and 120 healthy elderly (HE) samples. Features/biomarkers were ranked based on their p-values. The biomarkers include clinical dementia ratio (CDR), Mini-Mental State Exam (MMSE), delayed memory recall (DeRecall), immediate memory recall (Immediate Recall), gray matter (GM), average intensity of PiB, cerebrospinal fluid (CSF), and Apolipoprotein E (ApoE) genotype 1. Error bars represent a standard error.
Figure 3
Figure 3
Group statistical differences of the group pairs for GM-MRI and Pittsburgh compound B-positron emission tomography (PiB-PET) volumes. The rendered t-contrast maps obtained from unpaired two sample t-test factorial analysis of three group pairs, AD-vs.-HE, MCI-vs.-HE and AD-vs.-MCI for (A) GM and (B) PiB scans.
Figure 4
Figure 4
AD classification by simple multi-kernel learning (sKML) using combined GM-PiB imaging data. (A–C) Prediction plots (per fold). The decision threshold is displayed by a vertical line at the center of the plot. (D) Corresponding histograms of the function values of three groups modeled by sMKL. (E) Performance curve depending on the hyper-parameter values (C = 0.1, 1, 10, 100) with frequency of selection of each hyper-parameter, for three binary classification problems. (F) A summary of classification accuracies obtained by single and multi-modal data.
Figure 5
Figure 5
Weight (per region) maps modeled by multi-kernel learning (MKL) using GM-MRI data. Rendered MKL weights on a template. The results from a single modality GM-MRI data with an average of 75% contribution to (A) AD-vs.-HE, (B) MCI-vs.-HE and (C) AD-vs.-MCI classification problems. Weights for PiB-PET with lower (25% or less) contribution are not shown.
Figure 6
Figure 6
Predictions of diagnosis of individuals. A line prediction plot (predictions overlaid on targets) of diagnosis values of subjects derived from (A) GMs (B) PiB-PET scans modeled by kernel ridge regression (KRR) method and (C) combined GM-MRI and PiB-PET data modeled by sMKL. Proximity of sample data to any colored horizontal line denotes the likelihood of classifying under that particular diagnostic category associated with that line.
Figure 7
Figure 7
Correlation of estimated diagnosis values (modeled by sMKL) with true DeRecall scores and age values. (A) Line plots of estimated diagnosis values (similar to Figure 6C), (B) true DeRecall scores and (C) true age values. Dashed lines: outlier (transition candidates) samples. Down/upside arrows: correctly detected transitions.
Figure 8
Figure 8
Predictions of three target values using single and multi-modal data. (A–C) Line prediction plot of delay memory recall scores. Individual GM an PiB modeled by KRR while multimodal GM-PiB modeled by sMKL. The closer a particular predicted data (gray) to the targeted data (in green, red and blue), the better the accuracy of sample data.

References

    1. Albrecht M. A., Szoeke C., Maruff P., Savage G., Lautenschlager N. T., Ellis K. A., et al. . (2015). Longitudinal cognitive decline in the AIBL cohort: the role of APOEε4 status. Neuropsychologia 75, 411–419. 10.1016/j.neuropsychologia.2015.06.008 - DOI - PubMed
    1. Apostolova L. G., Thompson P. M., Rogers S. A., Dinov I. D., Zoumalan C., Steiner C. A., et al. . (2010). Surface feature-guided mapping of cerebral metabolic changes in cognitively normal and mildly impaired elderly. Mol. Imaging Biol. 12, 218–224. 10.1007/s11307-009-0247-7 - DOI - PMC - PubMed
    1. Ashburner J. (2007). A fast diffeomorphic image registration algorithm. Neuroimage 38, 95–113. 10.1016/j.neuroimage.2007.07.007 - DOI - PubMed
    1. Bateman R. J., Xiong C., Benzinger T. L. S., Fagan A. M., Goate A., Fox N. C., et al. . (2012). Clinical and biomarker changes in dominantly inherited Alzheimer’s disease. N. Engl. J. Med. 367, 795–804. 10.1056/NEJMoa1202753 - DOI - PMC - PubMed
    1. Bergouignan L., Chupin M., Czechowska Y., Kinkingnéhun S., Lemogne C., Le Bastard G., et al. . (2009). Can voxel based morphometry, manual segmentation and automated segmentation equally detect hippocampal volume differences in acute depression? Neuroimage 45, 29–37. 10.1016/j.neuroimage.2008.11.006 - DOI - PubMed

LinkOut - more resources