. 2017 Jul 21;6(7):e151.
doi: 10.1038/cti.2017.32. eCollection 2017 Jul.

Investigation of sphingosine kinase 1 in interferon responses during dengue virus infection

Affiliations

Investigation of sphingosine kinase 1 in interferon responses during dengue virus infection

Amanda L Aloia et al. Clin Transl Immunology. .

Abstract

Dengue virus (DENV) regulates sphingosine kinase (SK)-1 activity and chemical inhibition of SK1 reduces DENV infection. In primary murine embryonic fibroblasts (pMEFs) lacking SK1 however, DENV infection is enhanced and this is associated with induction of normal levels of interferon beta (IFN-β) but reduced levels of IFN-stimulated genes (ISGs). We have further investigated this link between SK1 and type I IFN responses. DENV infection downregulates cell-surface IFN-alpha receptor (IFNAR)1 in both wild-type (WT) and SK1-/- pMEF, but, consistent with poor ISG responses, shows reduced induction of phosphorylated (p)-STAT1 and key IFN regulatory factors (IRF)1 and -7 in SK1-/- pMEF. Direct IFN stimulation induced ISGs (viperin, IFIT1), CXCL10, IRF1 and -7 and p-STAT1. Responses, however, were significantly reduced in SK1-/- pMEF, except for IFN-stimulated CXCL10 and IRF7. Poor IFN responses in SK1-/- pMEF were associated with a small reduction in basal cell-surface IFNAR1 and IRF1 mRNA in uninfected SK1-/- compared with WT pMEF. In contrast, treatment of cells with the SK1 inhibitor, SK1-I or expression of an inhibitory SK1 short hairpin RNA (shRNA), both of which reduce DENV infection, does not alter basal IRF1 mRNA or affect type I IFN stimulation of p-STAT1. Thus, cells genetically lacking SK1 can induce many responses normally following DENV infection, but have adaptive changes in IFNAR1 and IRF1 that compromise DENV-induced type I IFN responses. This suggests a biological link between SK1 and IFN-stimulated pathways. Other approaches to reduce SK1 activity, however, do not influence these important antiviral pathways but reduce infection and may be useful antiviral strategies.


Conflict of interest statement

The authors declare no conflict of interest.

Figures

Figure 1
Figure 1
Cell-surface IFNAR1 is reduced and IFNAR2 mRNA is increased in both DENV-infected WT and SK1−/− pMEF. WT and SK1−/− pMEF were left uninfected or infected with DENV, as indicated directly on figures. (a) At 24 h pi cells were harvested and stained using APC-conjugated IFNAR1 or isotype control antibodies. Cells were fixed and subjected to flow cytometry. Representative histograms are shown; (b) as in a with av±s.e.m. of mean florescent intensity (MFI) from replicate (n=3) flow analysis from n=2 independent pMEF preparations; (c) RNA was extracted at the indicated time point pi and subjected to RT-PCR for IFNAR2. Results were normalised against cellular cyclophilin and relative RNA level determined by ΔCt method. Data represent av±s.e.m. from n=2 RT-PCR values from n=3 independent pMEF preparations and infection experiments. Representative replication profile of infectious DENV release is shown in Figure 2a. *P<0.05, Student's unpaired t-test.
Figure 2
Figure 2
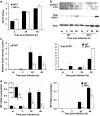
Poor induction of Y701-p-STAT1, IRF1 and IRF7 in SK1−/− pMEF following DENV infection. WT and SK1−/− pMEFs were infected with DENV and at the indicated time point pi culture supernatant, total cellular protein and RNA were harvested. (a) infectious virus release was quantitated from cell culture supernatant by plaque assay. Results are shown from n=2 WT and SK1−/− pMEF isolates and representative of n=6 independent pMEF isolations and infection experiments; (b) total protein was subjected to SDS-PAGE and western blot. Filters were serially probed for Y701-pSTAT1, total STAT1 and actin. Bound proteins were detected by chemiluminescence and images collected with a LAS-4000. Results from a single experiment are shown; (b) western blots from replicated experiments in two independent pMEF preparations and DENV infections were normalised and quantitated using Image J. Results represent av±s.d., n=2. (c) Total RNA was extracted and subjected to RT-PCR for IRF1 and IRF7. Results were normalised against cellular cyclophilin and relative RNA level determined by ΔCt method. Data represent av±s.e.m. from n=2 RT-PCR values from n=3 independent pMEF preparations and infection experiments. *P<0.05, Student's unpaired t-test.
Figure 3
Figure 3
IFN-β induction of IFN-stimulated pathways is reduced in SK1−/− pMEF. WT and SK1−/− pMEFs were stimulated with IFN-β (200 pg/ml). (a) At 8 h post stimulation, total RNA was harvested and subjected to RT-PCR for viperin, IFIT1 and CXCL10. Results were normalised against cellular cyclophilin and relative RNA level determined by ΔCt method. Data represent av±s.e.m. from n=2 RT-PCR values from n=2 independent pMEF preparations and stimulation experiments. *P<0.05, Student's unpaired t-test. (b) After 15–20 min IFN-β stimulation total protein was harvested and subjected to SDS-PAGE and western blot. Filters were serially probed for Y701-pSTAT1, total STAT1 and actin. Bound proteins were detected by chemiluminescence and images collected with a LAS-4000. Representative western blots are shown from experiments replicated in an independent pMEF preparation (n=2). (c) Total RNA was extracted and subjected to RT-PCR for IRF1 and IRF7, and results presented are as described in a.
Figure 4
Figure 4
Comparison of changes in protein and mRNAs in WT and SK1−/− pMEF following DENV infection or IFN-β stimulation. (a) Relative to WT pMEF: blue, unchanged; green, induced; yellow, induced but significantly lower; red, reduced; ND, not determined; *, inconclusive. (b) Summary of changes in basal, uninfected SK1−/− pMEF; (c) proposed pathways following DENV infection of SK1−/− pMEF.
Figure 5
Figure 5
Uninfected SK1−/− pMEFs have lower levels of IFNAR1 but normal cell morphology. (a) Uninfected WT and SK1−/− pMEFs were fixed and immunostained with α-tubulin with secondary detection using Alexa-555. Nuclei were stained with Hoechst and images collected by confocal microscopy. Representative images are shown. (b) Cells were harvested by scraping and stained using APC-conjugated IFNAR1 or isotype control antibodies, fixed and subjected to flow cytometery. Representative histograms are shown, with the minor change in MFI indicated by a vertical line; (c) as in b with av±s.e.m. of MFI from replicate flow analysis from n=2 independent pMEF preparations. Results from b, c are from the same experiments shown in Figure 1. Data represent av±s.e.m. from n=3 values. *P<0.05, Student's unpaired t-test.
Figure 6
Figure 6
Chemical or shRNA inhibition of SK1 does not affect basal IRF1 mRNA or IFN-β induction of p-STAT1 but SK1 shRNA expression reduces DENV infection. (a) HEK293 cells were treated with SK1-I for 90 min, and then stimulated with or without IFN-α (500 U ml−1) and total RNA and protein harvested. RNA was subjected to RT-PCR for IRF1 with normalisation against cellular cyclophilin and relative RNA level determined by ΔCt method. Data represent av±s.e.m. from n=3 RT-PCR values from n=2 independent pMEF replicates. Protein was subjected to SDS-PAGE and western blot. Filters were serially probed for Y701-pSTAT1 and actin. Bound proteins were detected by chemiluminescence and images collected with a LAS-4000. Results are shown from a single experiment that was replicated (n=2). (b) Control or SK1 shRNA cells were treated with DOX for the time indicated. Cells were harvested, lysed and SK1 activity quantitated. Activity was normalised against total protein and expressed relative to activity in control shRNA cells. Data represent av±s.d. from n=2 values. * indicates significantly different to control 0-h post DOX, ** indicates significantly different to control or SK1 shRNA 0-h post DOX, P<0.05, Student's t-test. (c) HEK293 cells containing a DOX-inducible SK1 shRNA were treated overnight with DOX and then stimulated with IFN-α and IRF1 mRNA, and Y701-p-STAT1 measured as described in a; (d) HEK293 cells containing a DOX-inducible control or SK1 shRNA were treated overnight with DOX, DENV-infected and supernatants harvested at 24 h pi and analysed by plaque assay. Results represent av±s.e.m. from n=4 assay values from n=2 independent infection experiments. * indicates significantly different to control-DOX, ** indicates significantly different to SK1 shRNA-DOX, P<0.05, Student's t-test.

References

    1. Bhatt S, Gething PW, Brady OJ, Messina JP, Farlow AW, Moyes CL et al. The global distribution and burden of dengue. Nature 2013; 496: 504–507. - PMC - PubMed
    1. Kyle JL, Harris E. Global spread and persistence of dengue. Annu Rev Microbiol 2008; 62: 71–92. - PubMed
    1. Schoggins JW. Interferon-stimulated genes: roles in viral pathogenesis. Curr Opin Virol 2014; 6: 40–46. - PMC - PubMed
    1. Castillo Ramirez JA, Urcuqui-Inchima S. Dengue virus control of type I IFN responses: a history of manipulation and control. J Interferon Cytokine Res 2015; 35: 421–430. - PMC - PubMed
    1. Suthar MS, Aguirre S, Fernandez-Sesma A. Innate immune sensing of flaviviruses. PLoS Pathog 2013; 9: e1003541. - PMC - PubMed

LinkOut - more resources