. 2017 Aug 2:4:17035.
doi: 10.1038/hortres.2017.35. eCollection 2017.

Patterns of genomic and phenomic diversity in wine and table grapes

Affiliations

Patterns of genomic and phenomic diversity in wine and table grapes

Zoë Migicovsky et al. Hortic Res. .

Abstract

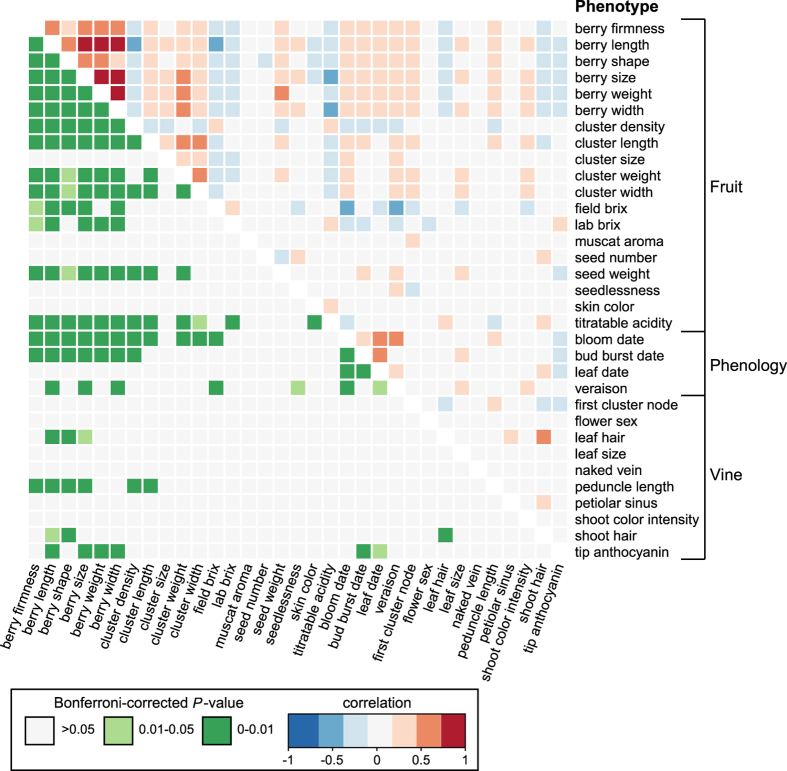
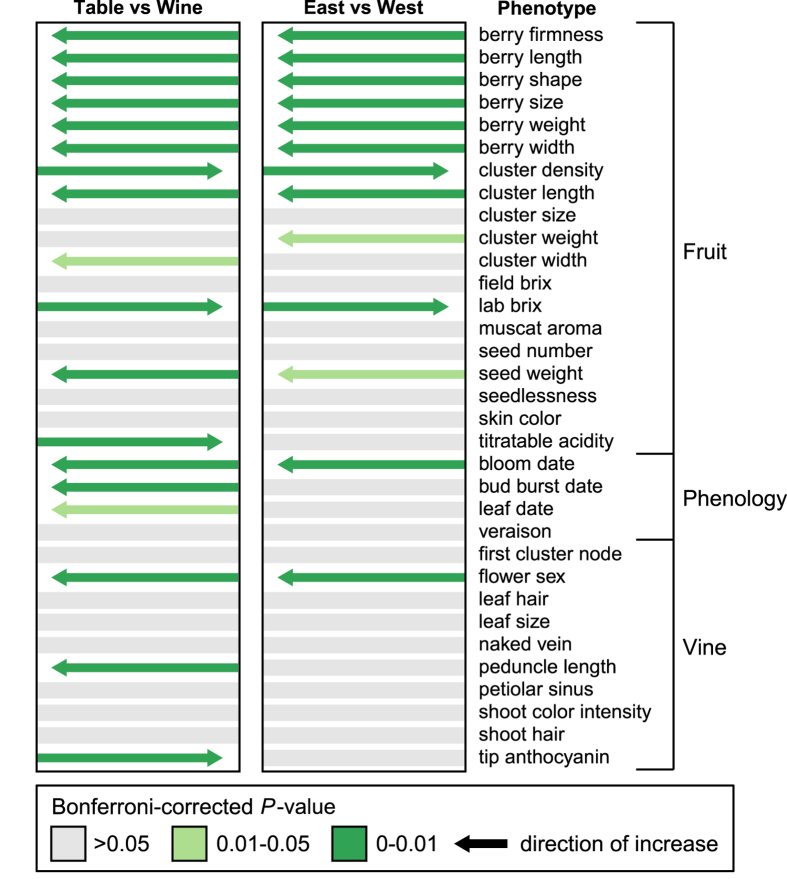
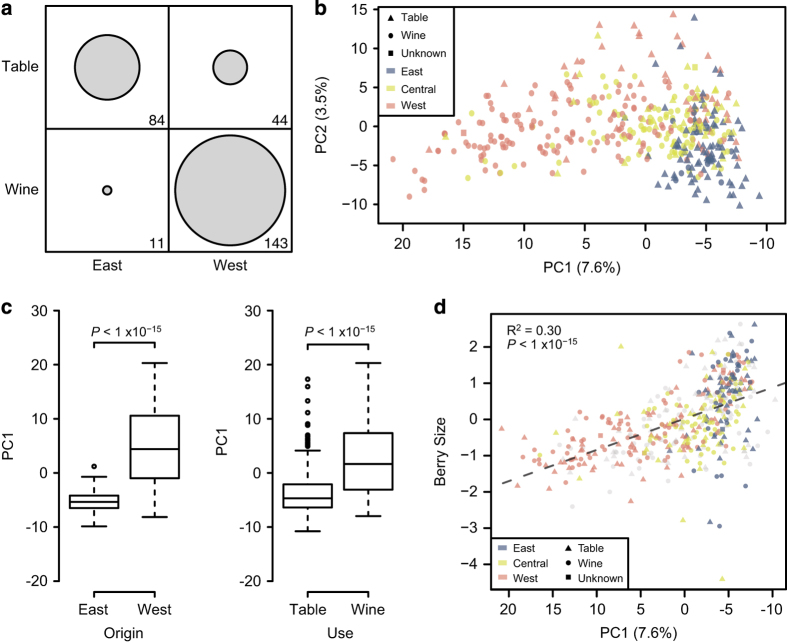
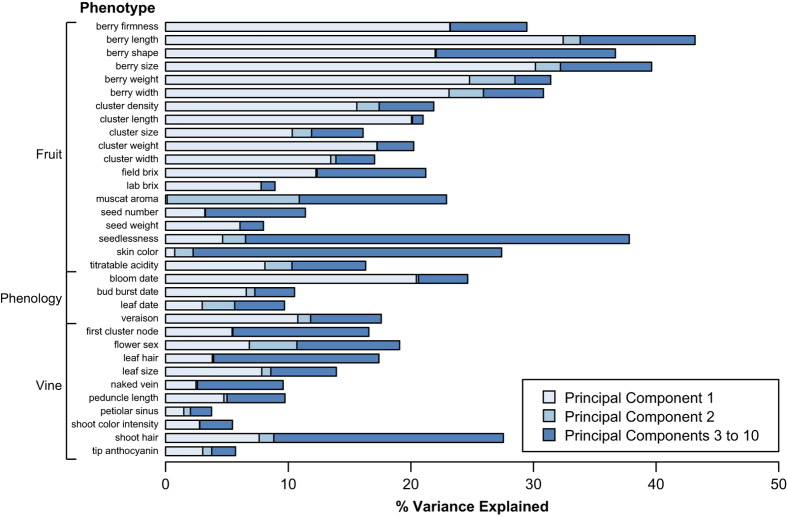
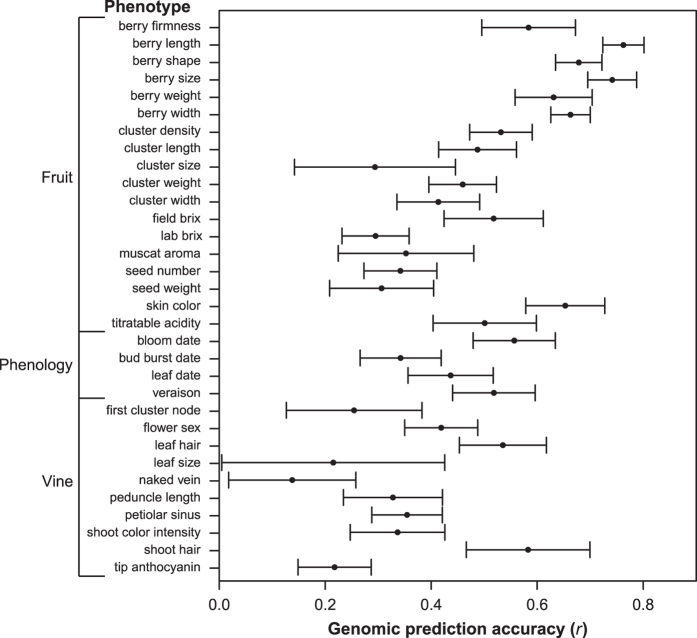
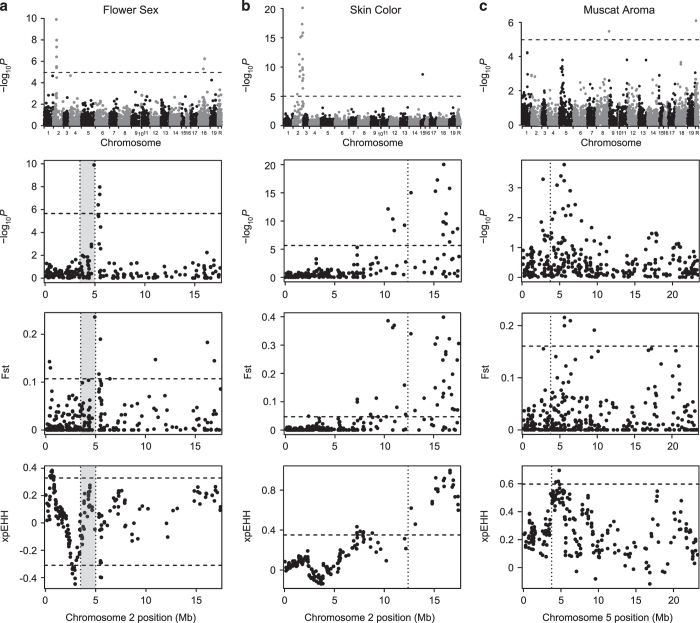
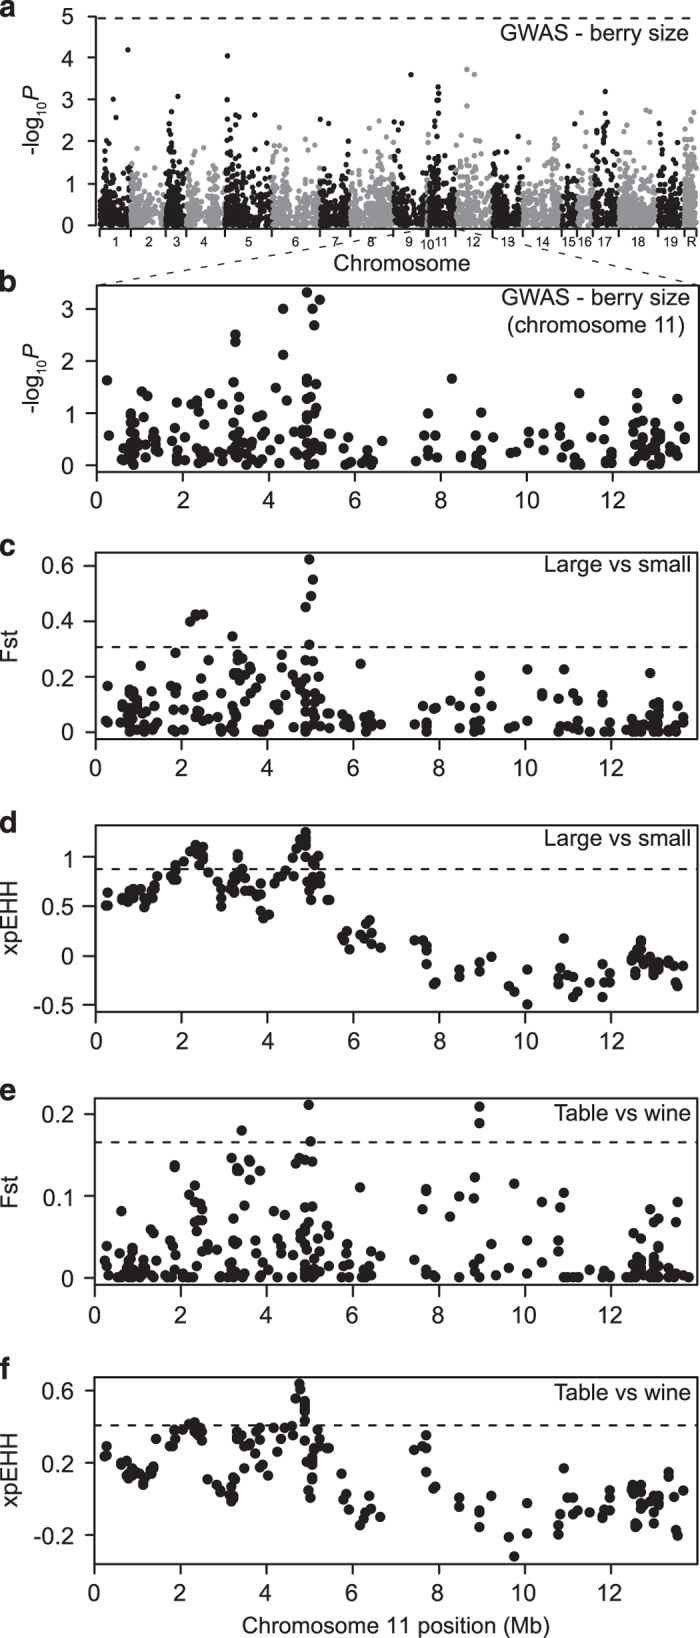
Grapes are one of the most economically and culturally important crops worldwide, and they have been bred for both winemaking and fresh consumption. Here we evaluate patterns of diversity across 33 phenotypes collected over a 17-year period from 580 table and wine grape accessions that belong to one of the world's largest grape gene banks, the grape germplasm collection of the United States Department of Agriculture. We find that phenological events throughout the growing season are correlated, and quantify the marked difference in size between table and wine grapes. By pairing publicly available historical phenotype data with genome-wide polymorphism data, we identify large effect loci controlling traits that have been targeted during domestication and breeding, including hermaphroditism, lighter skin pigmentation and muscat aroma. Breeding for larger berries in table grapes was traditionally concentrated in geographic regions where Islam predominates and alcohol was prohibited, whereas wine grapes retained the ancestral smaller size that is more desirable for winemaking in predominantly Christian regions. We uncover a novel locus with a suggestive association with berry size that harbors a signature of positive selection for larger berries. Our results suggest that religious rules concerning alcohol consumption have had a marked impact on patterns of phenomic and genomic diversity in grapes.


Conflict of interest statement

The authors declare no conflict of interest.

Figures

Figure 1
Figure 1
Correlations among grape phenotypes. Correlations were calculated using Pearson’s, Spearman’s or Kendall’s correlations depending on phenotypes compared (see Materials and methods). Values above the diagonal are colored to indicate the correlation results (r) and those below the diagonal indicate Bonferroni-corrected P-values.
Figure 2
Figure 2
Relationship between grape phenotype and use or origin. Each phenotype was divided into two groups according use (table or wine) and origin (East or West) and compared. Significant increases are indicated by the direction of the arrow. P-values are Bonferroni-corrected.
Figure 3
Figure 3
Genetic structure based on use, geographic origin, berry size and berry color. Principal component analysis (PCA) was performed using genome-wide SNP data. The percentage of the variance explained by each PC is indicated in parentheses along each axis. (a) In all, 282 accessions had information for both geographic origin and use. Circled areas are proportional to the number of observations within each category. Plot was created using the R package tableplot. (b) Accessions are labeled according to use with point shape (table, wine or unknown) as well as geographic origin in Europe based on point color (East, Central or West). PCs were determined using all accessions, but only those with geographic information are shown. (c) Boxplot of PC1 values for East and West as well as wine and table grapes. Results are reported from a Mann–Whitney U-test. (d) Correlation (r2) between PC1 and berry size. Accessions are labeled according to use (point shape) and geography (point color). Accessions without use or geography information are colored in gray. R2 and P-value are reported from a Pearson correlation test. The PC1 axis is shown in reverse order to be consistent with geography (that is, East to the right and West to the left).
Figure 4
Figure 4
Proportion of variance explained for each phenotype using PCs 1–10. PCs were calculated using genome-wide SNPs.
Figure 5
Figure 5
Genomic prediction accuracy for each phenotype. r- values represent the correlation between observed and predicted phenotype scores (+/− standard deviation) using a fivefold cross-validation procedure and rrBLUP model repeated three times.
Figure 6
Figure 6
GWAS and selection scan results for (a) flower sex, (b) skin color and (c) Muscat aroma. Full Manhattan plot of GWAS results and Manhattan plot of GWAS results on chromosome with significant result only. P-values are log-transformed. The horizontal dotted line indicates a Bonferroni-corrected P-value threshold for significance. Chromosome R indicates SNPs found on contigs that remain unanchored to the reference genome. Fst and xpEHH selection scan profiles for corresponding GWAS results on the chromosome of interest. The horizontal dotted lines indicate the top and bottom 1% values for each test across the entire genome. The known loci for flower sex (a), skin color (b) and muscat aroma (c) in grapes are indicated by a vertical dotted line.
Figure 7
Figure 7
GWAS results for berry size as well as selection scans comparing accessions based on berry size and use. (a) Full Manhattan plot of GWAS results for berry size. Chromosome R indicates SNPs found on contigs that remain unanchored to the reference genome. (b) Manhattan plot of GWAS results on chromosome 11 only. P-values are log-transformed. The horizontal dotted line on GWAS plots indicates a Bonferroni-corrected P-value threshold for significance. (c) Fst and (d) xpEHH selection scan profiles comparing top 10% of largest grapes to 10% smallest grapes. (e) Fst and (f) xpEHH selection scan profiles comparing table to wine grapes. The horizontal dotted lines for selection scans indicate the top 1% of values for each test across the entire genome.

References

    1. McGovern PE. Ancient wine: the search for the origins of viniculture. Princeton University Press. Chapter 1 Stone Age Wine, Pages 1–15 2003.
    1. OIV. OIV report on the world vitivinicultural situation. Available from http://www.oiv.int/public/medias/4906/press-release-2016-bilan-en.pdf (Accessed 25 November 2016).
    1. Bacilieri R, Lacombe T, Le Cunff L, et al. Genetic structure in cultivated grapevines is linked to geography and human selection. BMC Plant Biol 2013; 13: 25. - PMC - PubMed
    1. This P, Lacombe T, Thomas MR. Historical origins and genetic diversity of wine grapes. Trends Genet 2006; 22: 511–519. - PubMed
    1. Fournier-Level A, Lacombe T, Le Cunff L, Boursiquot JM, This P. Evolution of the VvMybA gene family, the major determinant of berry colour in cultivated grapevine (Vitis vinifera L.). Heredity 2010; 104: 351–362. - PubMed