. 2017 Aug 7;4(4):ENEURO.0059-17.2017.
doi: 10.1523/ENEURO.0059-17.2017. eCollection 2017 Jul-Aug.

Temporal Processing in the Visual Cortex of the Awake and Anesthetized Rat

Affiliations

Temporal Processing in the Visual Cortex of the Awake and Anesthetized Rat

Ida E J Aasebø et al. eNeuro. .

Abstract

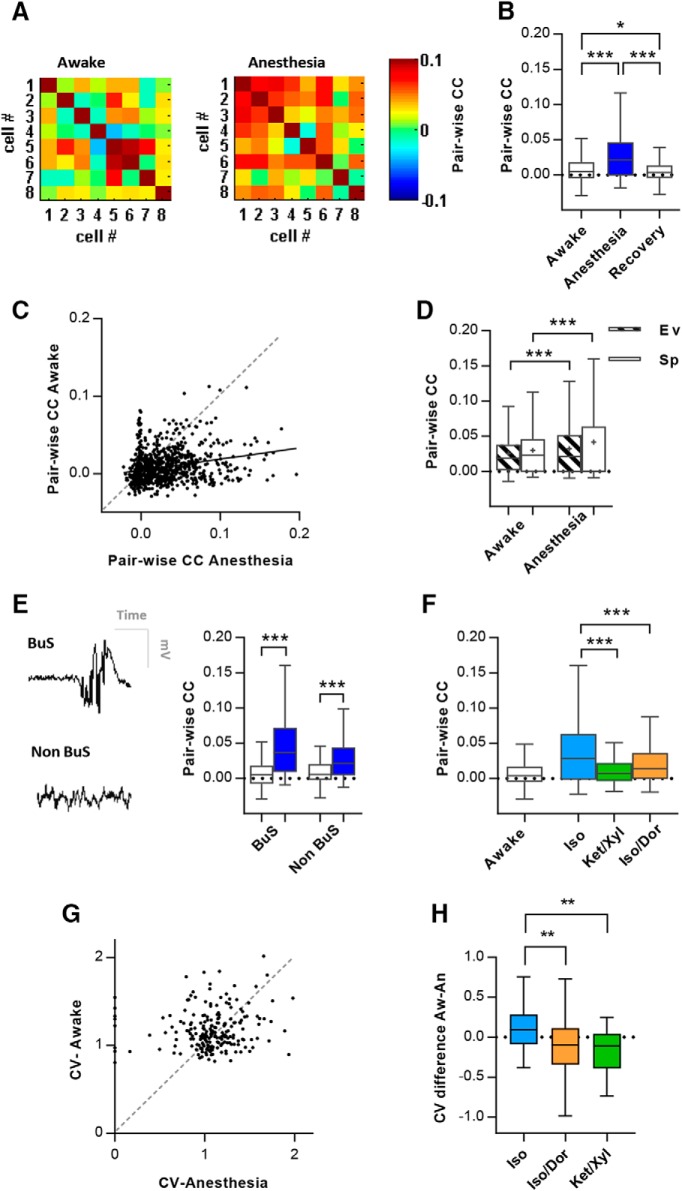
The activity pattern and temporal dynamics within and between neuron ensembles are essential features of information processing and believed to be profoundly affected by anesthesia. Much of our general understanding of sensory information processing, including computational models aimed at mathematically simulating sensory information processing, rely on parameters derived from recordings conducted on animals under anesthesia. Due to the high variety of neuronal subtypes in the brain, population-based estimates of the impact of anesthesia may conceal unit- or ensemble-specific effects of the transition between states. Using chronically implanted tetrodes into primary visual cortex (V1) of rats, we conducted extracellular recordings of single units and followed the same cell ensembles in the awake and anesthetized states. We found that the transition from wakefulness to anesthesia involves unpredictable changes in temporal response characteristics. The latency of single-unit responses to visual stimulation was delayed in anesthesia, with large individual variations between units. Pair-wise correlations between units increased under anesthesia, indicating more synchronized activity. Further, the units within an ensemble show reproducible temporal activity patterns in response to visual stimuli that is changed between states, suggesting state-dependent sequences of activity. The current dataset, with recordings from the same neural ensembles across states, is well suited for validating and testing computational network models. This can lead to testable predictions, bring a deeper understanding of the experimental findings and improve models of neural information processing. Here, we exemplify such a workflow using a Brunel network model.

Keywords: anesthesia; awake; computational modeling; single units; temporal sequences; visual cortex.


Figures

Figure 1.
Figure 1.
Single unit activity followed between the awake state, anesthesia, and the recovery from anesthesia. A, Two example units in all three states, spike waveforms and spike clusters are shown. B, Box plot of the firing rates of the units from recording sessions in the awake state, anesthesia, and recovery from anesthesia (n = 193). C, Scatter plot of the firing rates for all single units in the awake and anesthetic state. D, Single ensemble of 17 simultaneously recorded units illustrating within-ensemble variations of firing rate reduction with anesthesia (Isoflurane). E, Firing rates in active and sessile sessions relative to anesthesia (n = 51). F, right panel, Scatter plot of wave form properties of the spikes of all units, y-axis represent the time from peak to trough (ms) and the x-axis shows the duration (ms) of the peak at half amplitude. Green: NS = narrow spiking units (n = 31); black: BS = broad spiking units (n = 209); orange: Tri = triphasic units (n = 11). Left panel, Example waveforms of BS, NS, and Tri-units. G, Firing rate of narrow spiking units (n = 31) versus broad spiking units (n = 209) in the awake and anesthetized state. H, Firing rates in three different anesthetic regimes: Isoflurane/Dormicum (n = 145), Isoflurane (n = 70), Ketamine/Xylazine (n = 49). I, Percentage of units that respond to anesthesia with an increase in firing rate. J, Difference in firing rates between the first 10 and the last 60 min of anesthesia (Iso/Dor n = 109, Iso n = 65, Ket/Xyl n = 45). K, Raster plot of the evoked- spontaneous index for each unit in the awake and anesthetic state (n = 257). L, Box plot of indexes calculated on spontaneous activity in both states, and evoked activity in both states for each unit. M, Evoked and spontaneous index for units across three anesthetic regimes (Iso n = 70, Ket/Xyl n = 48, Iso/Dor n = 133). All box and whiskers plots line show median, upper quartile, lower quartile and whiskers indicate Tukey interquartile range.
Figure 2.
Figure 2.
Evoked response latencies of the LFP and single units followed from the awake state to anesthesia. A, Example traces from one experiment in awake and anesthesia showing the typical LFP signature following stimulus onset. B, Box plot of the latency of the stimulus onset to the trough and peak of the LFP signature *1.5 SD of the mean (n = 17). C, Comparison of the time between trough and peak in each condition. D, Comparison of amplitude (mV) of troughs and peaks in each condition. E, Top, Average stimulus-evoked LFP in awake and anesthesia across all experiments (n = 25 in nine animals). Error bars indicate SEM. Bottom, Morlet wavelet of LFP activity following visual stimulation in the awake and anesthetized animals. F, Stimulus evoked firing rates (top) and raster plots (bottom) of all trials in all units in each state. One line represents one trial (96 trials per unit). Trials are ranked according to awake firing rates from high to low rate from (bottom up) for each anesthetic. G, PSTH of evoked firing rates for all units followed between the awake and anesthetized state (error bars, SEM). H, PSTH of normalized firing rates spanning the time period of the average peak of evoked activity. I, Scatterplot showing latency (ms) to the first peak evoked response for all units in awake and anesthesia. Red dotted line indicates regression. J, Box plot comparing bins of first peak max responses and first peak onset for all units between awake and anesthesia (n = 262,130). K, Frequency distribution of the awake-anesthesia difference in latency for each unit. L, Box plot showing first peak latency for units in three anesthetic regimes (Iso/Dor n = 133, Iso n = 71, Ket/Xyl n = 47).
Figure 3.
Figure 3.
Temporal structure parameters, pairwise correlations and CV, of units followed between states. A, Pair-wise CC matrix for an example population (8 units) in both states. B, Box plot showing the CC for all pairwise correlations in awake, anesthesia and recovery (n = 733 cell-pairs). C, Scatter plot of pair-wise CC for pairs of neurons in the awake and anesthetized state (n = 1046). Black line indicates regression. D, Box plot showing the CCs during stimulus-evoked and spontaneous activity for all units. E, left panel, Example LFP trace with a typical burst suppression (BuS) pattern and no burst suppression (non-BuS). Right panel, Box plot showing CCs for pairs in sessions dominated by burst suppression (n = 276) compared with non-BS sessions (n = 210). F, Box plot showing the CCs for cell-pairs in three different anesthetic regimes: Isoflurane (n = 371), Ketamine/Xylazine (n = 246), and Isoflurane/Dormicum (n = 436). G, Scatter plot of the CV for single units in the awake and anesthetized state (n = 218). H, Box plot of the awake-anesthetized CV difference for units in each anesthetic regime (Iso n = 56, Iso/Dor n = 118, Ket/Xyl n = 44).
Figure 4.
Figure 4.
Temporal sequences within unit ensembles followed between states. A, Top panel, Description of MSL measure. Left, Raster plot of two representative units firing with different MSL to visual stimuli. Right, illustration of sequence representation for MSL measure. Bottom panels, MSL (red dots) for units within ensembles, sorted by their ranked sequence (MSL) in the other session. Gray indicates activity normalized between 0 and 1 (awake-awake, n = 88; awake-anesthesia, n = 82; anesthesia-anesthesia, n = 78). B, top panel, Illustration of the quantification of the single trial rank measure. Bottom panels, Histograms of single trial rank CCs. MSLs for individual stimuli presentations are rank correlated with the mean latency response across many stimuli presentations from a separate experimental session (awake-awake, n = 604; awake-anesthesia, n = 596; anesthesia-anesthesia, n = 294). Yellow outline indicates shuffled data. C, top panel, The rank-by-rank measure is described. Bottom panel, Line graph showing the CCs from the rank-by-rank measure for the individual populations (n = 8 populations). D, Single trial rank correlations for the sessile-movement (n = 352) and movement-anesthesia (n = 402) comparisons. E, Single trial rank correlations for the awake-anesthesia and anesthesia-anesthesia comparisons for three different anesthetic regimes: Isoflurane, isoflurane-Dormicum, and Ketamine/Xylazine. F, Example populations, from the three anesthetic regimes (Iso n = 15 units, Ket/Xyl n = 19, Iso-Dor n = 8).
Figure 5.
Figure 5.
Responses to visual stimuli of different spatial frequencies between awake and anesthesia (AG). A, The possible position of the awake rats in the recording box gives a theoretical range of spatial frequencies of the stimuli. The maximum and minimum size of cycles considering varied distance to screen is plotted and show that overlap is restricted to one spatial frequency group. B, Average normalized firing rates for all units in each spatial frequency (n = 68). Error bars indicate SEM. Firing rates normalized by scaling between 0 and 1. C, Number of units responding maximally to each spatial frequency in awake and anesthesia. D, left panel, Comparison of normalized activity in awake and anesthesia during visual stimuli with low spatial frequencies (0.02 and 0.04 c/d) for units preferring a low spatial frequency stimuli in the awake state (n = 75). Right panel, Same for units preferring high spatial frequencies of visual stimuli in awake (0.16 and 0.3 c/d; n = 75). E, PSTH for an example unit during visual stimuli with a low spatial frequency (top panel) and a high spatial frequency (bottom panel) in the awake state and during anesthesia. F, Scatterplot of evoked latencies for the lowest spatial frequency (0.02 c/d) and the highest spatial frequency (0.3 c/d) for the awake state (left panel) and during anesthesia (right panel). G, Box plot of first peak latencies for units under five different spatial frequencies during awake and anesthesia. Responses to visual stimuli of different temporal frequencies between awake and anesthesia (HJ). H, Average normalized firing rates for all units in each temporal frequency. I, Number of units responding maximally to each temporal frequency in awake and anesthesia. J, Box plot of first peak latencies for units under visual stimulation with three different temporal frequencies during awake and anesthesia. Error bars indicate SEM. Firing rates normalized by scaling between 0 and 1.
Figure 6.
Figure 6.
Awake-anesthesia data compared to data from the Brunel-type network model. Anesthetics are color coded. A, left panel, Spontaneous rate. Right panel, Evoked rate. B, left panel, Pairwise CCs. Right panel, CV. C, Peak latency (ms). D, Probability density of the membrane potential in the awake (left panel) and anesthetized (right panel) network model. E, left panel, Network model threshold distributed mean. Right panel, Threshold distributed variance.

Similar articles

Cited by

References

    1. Alitto HJ, Moore BD, Rathbun DL, Usrey WM (2011) A comparison of visual responses in the lateral geniculate nucleus of alert and anaesthetized macaque monkeys. J Physiol 589:87–99. 10.1113/jphysiol.2010.190538 - DOI - PMC - PubMed
    1. Alonso JM, Usrey WM, Reid RC (2001) Rules of connectivity between geniculate cells and simple cells in cat primary visual cortex. J Neurosci 21:4002–4015. - PMC - PubMed
    1. Andermann ML, Kerlin AM, Roumis DK, Glickfeld LL, Reid RC (2011) Functional specialization of mouse higher visual cortical areas. Neuron 72:1025–1039. 10.1016/j.neuron.2011.11.013 - DOI - PMC - PubMed
    1. Angel A, Berridge D, Unwin J (1973) The effect of anaesthetic agents on primary cortical evoked responses. Brit J Anaesth 45:824–836. - PubMed
    1. Armstrong-James M, George MJ (1988) Influence of anesthesia on spontaneous activity and receptive field size of single units in rat Sm1 neocortex. Exp Neurol 99:369–387. - PubMed

Publication types

MeSH terms

LinkOut - more resources