Review
. 2017 Oct;18(10):637-650.
doi: 10.1038/nrm.2017.63. Epub 2017 Aug 9.

Splicing and transcription touch base: co-transcriptional spliceosome assembly and function

Affiliations
Review

Splicing and transcription touch base: co-transcriptional spliceosome assembly and function

Lydia Herzel et al. Nat Rev Mol Cell Biol. 2017 Oct.

Abstract

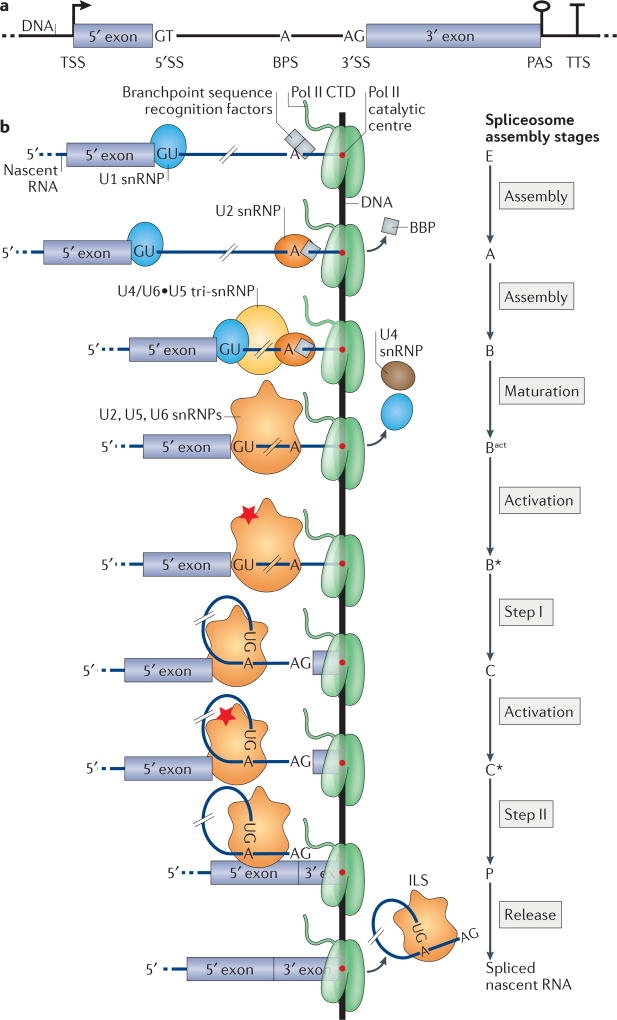
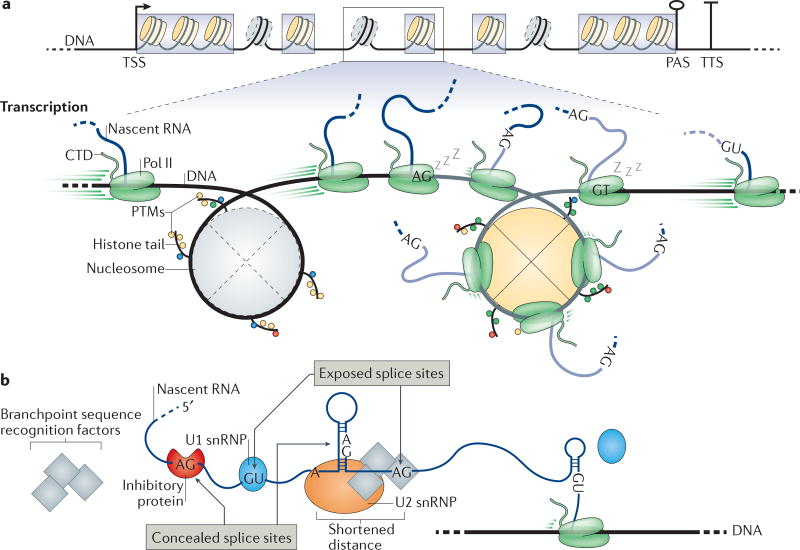
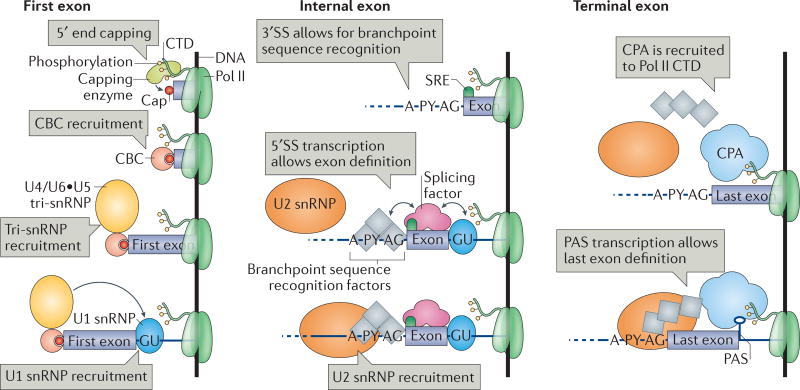
Several macromolecular machines collaborate to produce eukaryotic messenger RNA. RNA polymerase II (Pol II) translocates along genes that are up to millions of base pairs in length and generates a flexible RNA copy of the DNA template. This nascent RNA harbours introns that are removed by the spliceosome, which is a megadalton ribonucleoprotein complex that positions the distant ends of the intron into its catalytic centre. Emerging evidence that the catalytic spliceosome is physically close to Pol II in vivo implies that transcription and splicing occur on similar timescales and that the transcription and splicing machineries may be spatially constrained. In this Review, we discuss aspects of spliceosome assembly, transcription elongation and other co-transcriptional events that allow the temporal coordination of co-transcriptional splicing.


Figures

Figure 1
Figure 1. Yeast gene architecture and co-transcriptional spliceosome assembly
a | Typical architecture of a budding yeast gene that contains one intron. The transcription start site (TSS), poly(A) site (PAS) and transcription termination site (TTS) are shown; for simplicity, only one of each site is represented. b | Co-transcriptional recruitment of small nuclear ribonucleoproteins (snRNPs) and splicing. The recruitment of U1 snRNP and the yeast branchpoint sequence (BPS) recognition factors (branchpoint binding protein (BBP) and Mud2) results in complex E. U2 snRNP recruitment and the concomitant displacement of BBP results in complex A. Upon recruitment of the U4/U6•U5 tri-snRNP complex B is formed. The subsequent release of the U1 and U4 snRNPs converts complex B into mature Bact, which contains the U2, U5 and U6 snRNPs. Catalytic activation (red star) yields complex B*. Step I catalysis produces complex C, which contains the 5′ exon and the branched intron lariat-3′ exon. Step II, which is catalysed by activated complex C*, produces complex P, which contains the ligated 5′ exon-3′ exon and the excised intron lariat. Spliced nascent RNA and intron lariat spliceosome (ILS) are then released. The 3′ end of the nascent RNA lies in the catalytic centre of RNA polymerase II (Pol II). The hatch marks on each nascent RNA replace the much longer sequence of the intron between the 5′SS and the BPS. CTD, carboxy-terminal domain; SS, splice site.
Figure 2
Figure 2. Crosstalk of the assembling spliceosome with nuclear gene expression machineries
The crosstalk of the components of the small nuclear ribonucleoproteins (snRNPs) and the different spliceosome assembly stages with nuclear gene expression factors and complexes is underlined by a multitude of genetic and physical interactions. Genetic and physical interactions that involve core splicing factors of Saccharomyces cerevisiae were obtained from the Biological General Repository for Interaction Datasets (BioGRID). Protein complex annotations were derived from the CYC2008 yeast proteins catalogue and the Spliceosome Database. Only predominantly nuclear complexes that are involved in chromatin biology, transcription and RNA-related nuclear processes were considered (Supplementary information S2 (table)). The grey scale reflects the number of reported interactions between spliceosomal and non-spliceosomal complex subunits. The number of reported interactions is adjusted to the number of reported non-spliceosomal complex subunits. A minimum of two reports for the same interaction was required. Overall, chromatin-modifying and chromatin-remodelling complexes display predominantly genetic interactions. Fewer reports exist of physical interactions, with the exception of core spliceosomal complexes (Supplementary information S2 (table)) and the 5′ and 3′ end processing machineries. In line with mechanistic studies (see the main text), specific genetic interactions have been reported between the cap-binding complex (CBC) and some spliceosomal complexes, but an extensive physical interaction network (possibly mediated through the nascent RNA) has been mapped with all spliceosomal complexes. The full non-spliceosomal complex and protein names are given in Supplementary information S3 (table). Tri, tri-snRNP; U1, U1 snRNP; U2, U2 snRNP.
Figure 3
Figure 3. Patterns of RNA polymerase II C-terminal domain phosphorylation, small nuclear ribonucleoprotein binding and splicing along an average intron-containing budding yeast gene
a | Comparison of RNA polymerase II (Pol II) carboxy-terminal domain (CTD) phosphorylation profiles and small nuclear ribonucleoprotein (snRNP) binding profiles from different studies. Heatmap of average CTD phosphorylation profiles (top) normalized to total Pol II profiles (the total Pol II profile was not available for REF. 66) for the 50% of intron-containing genes with the highest snRNP signal over terminal exons (snRNP data are from REF. and Pol II CTD data are from REFS –67). In most data sets, Ser5 and Ser7 phosphorylation is most abundant in the first exon and in the intron (most budding yeast genes contain one intron), whereas phosphorylation of the other CTD repeat residues is high over the terminal exon and/or the poly(A) site (PAS), pointing to a transition in CTD phosphorylation profiles around the 3′ splice sites (3′SSs). Note that the data sets differ in experimental procedure (chromatin immunoprecipitation (ChIP)–chip, ChIP-Nexus, ultraviolet (UV) crosslinking and analysis of cDNAs (CRAC)) and the antibodies used. A heatmap of average U1 and U2 snRNPs binding profiles (data are from REFS 30, 66) (bottom) for the same intron-containing genes illustrates stepwise co-transcriptional spliceosome assembly. b | Schematic of step II splicing kinetics in yeast and hypothetical step I splicing kinetics. The kinetics of the spliceosome assembly stages — the transition from B complexes (including B, Bact and B*) to C complexes during step I, and the transition from C complexes (including C and C*) to P during step II — have not yet been determined. Hypothetical splicing assembly stage transitions and global CTD phosphorylation changes are indicated by the colour gradient. A, branch adenosine; TSS, transcription start site.
Figure 4
Figure 4. Gene architecture, chromatin features and nascent RNA properties influence co-transcriptional splicing
a | The length of typical internal exons (grey boxes) is comparable to the DNA that is wrapped around a nucleosome. Nucleosome positioning relative to the transcription start site (TSS), transcription termination site (TTS) and, to a lesser extent, exons helps to define the boundaries of these elements, providing a platform for crosstalk between chromatin, transcription and splicing. Less stable nucleosomes at introns are indicated with dashed outlines. For simplicity, only one TSS, poly(A) site (PAS) and TTS are depicted. The zoomed-in section shows that RNA polymerase II (Pol II) transcription rates change along introns (black lines with grey nucleosomes) and exons (grey lines with yellow nucleosomes) from high rates to low rates. A sleeping Pol II represents pausing events at splice sites (AG and GT). Post-translational modifications (PTMs) on histone tails influence transcription and splicing. b | RNA secondary structures and RNA-binding proteins can modulate the availability of splice sites and branchpoint sequences. The splicing machinery cannot identify sites that are concealed in secondary structures or that are bound by inhibitory proteins. Pol II transcription rate and local RNA folding contribute to site accessibility. CTD, carboxy-terminal domain; snRNP, small nuclear ribonucleoprotein.
Figure 5
Figure 5. First, internal and terminal exon definition
As a prerequisite to first exon definition, the capping enzyme that is bound to the phosphorylated RNA polymerase II (Pol II) carboxy-terminal domain (CTD) adds a cap to the 5′ end of the nascent RNA. The cap-binding complex (CBC) recruits the U4/U6•U5 tri-small nuclear ribonucleoprotein (snRNP) and mediates the association of the U1 snRNP with the first 5′ splice site (SS). In internal exon definition, the transcription of an internal 3′SS and the downstream 5′SS triggers the recruitment of the U1 snRNP, the branchpoint sequence recognition factors (splicing factor 1 (SF1), U2AF65 and U2AF35) and the U2 snRNP. Splicing factors facilitate or inhibit exon definition by binding to splicing regulatory elements (SREs), leading to alternative splicing. As a prerequisite to terminal exon definition, the cleavage and polyadenylation complex (CPA) interacts with the poly(A) site (PAS), phosphorylated Pol II CTD and the splicing machinery, aiding 3′SS identification. In addition, the splicing machinery helps CPA recruitment onto the PAS. A, branch adenosine; P Y, polypyrimidine tract.
Figure 6
Figure 6. Higher-order organization of the gene expression machineries
a | The nucleus and cytoplasm contain membrane-less compartments, known as bodies, such as the nucleolus, Cajal bodies, histon locus bodies, speckles and P-bodies. Such bodies form through liquid–liquid phase separation (LLPS) and are often linked to the transcription of specific genes, for example, ribosomal DNA (rDNA) in the nucleolus, small nuclear RNA (snRNA) genes in Cajal bodies and histone genes in histone locus bodies. We propose that looped and actively transcribed genes (genes w, x, y and z) are also likely to form nuclear bodies. b | Spliceosome proteins, particularly chromatin and transcription-associated proteins, are predicted to have a similar proportion of unstructured protein regions to those of other groups of proteins that are known to be involved in LLPS, as shown in the cumulative representation of the complete proteome and the protein groups associated with specific Gene Ontology terms (cellular component: P-body, nucleolus, chromatin (binding); biological process: DNA-templated transcription, mRNA splicing via spliceosome and transport). The data were downloaded from the Saccharomyces Genome Database (Supplementary information S3 (table)). The cumulative fraction of proteins (y axis) is given in association with the percentage of amino acids per protein that have a high probability of being in a disordered region (x axis), according to predictions by IUPred. Whereas 50% of transport proteins and the entire proteome contain 7% or fewer amino acids with a high tendency to form disordered regions, 50% of the P-body, nucleolar or chromatin and transcription-associated proteins contain 25–30% of such amino acids. The median fraction of amino acid disorder tendency for spliceosomal proteins is 16%. Medians are represented by light grey lines. CBC, cap-binding complex; CPA, cleavage and polyadenylation complex; Pol I, RNA polymerase I.

References

    1. Sakharkar MK, Perumal BS, Sakharkar KR, Kangueane P. An analysis on gene architecture in human and mouse genomes. In Silico Biol. 2005;5:347–365. - PubMed
    1. Wahl MC, Will CL, Lührmann R. The spliceosome: design principles of a dynamic RNP machine. Cell. 2009;136:701–718. - PubMed
    1. Brugiolo M, Herzel L, Neugebauer KM. Counting on co-transcriptional splicing. F1000 Prime Reports. 2013;5:9. - PMC - PubMed
    1. Carrillo Oesterreich F, et al. Splicing of nascent RNA coincides with intron exit from RNA polymerase II. Cell. 2016;165:372–381. Shows a tight match between progress in transcription and splicing completion in vivo. - PMC - PubMed
    1. Alpert T, Herzel L, Neugebauer KM. Perfect timing: splicing and transcription rates in living cells. Wiley Interdiscip. Rev. RNA. 2016;8:e1401. - PMC - PubMed

LinkOut - more resources