

Progression of regional atrophy in the left hemisphere contributes to clinical and cognitive deterioration in multiple sclerosis: A 5-year study
- PMID: 28792103
- PMCID: PMC6866796
- DOI: 10.1002/hbm.23755
Progression of regional atrophy in the left hemisphere contributes to clinical and cognitive deterioration in multiple sclerosis: A 5-year study
Abstract
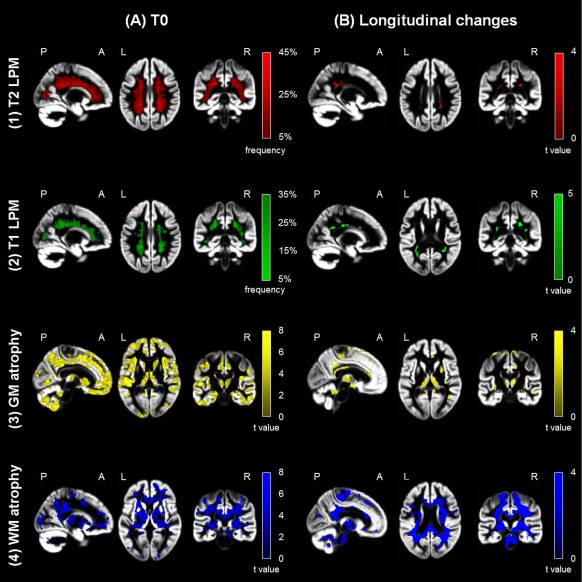
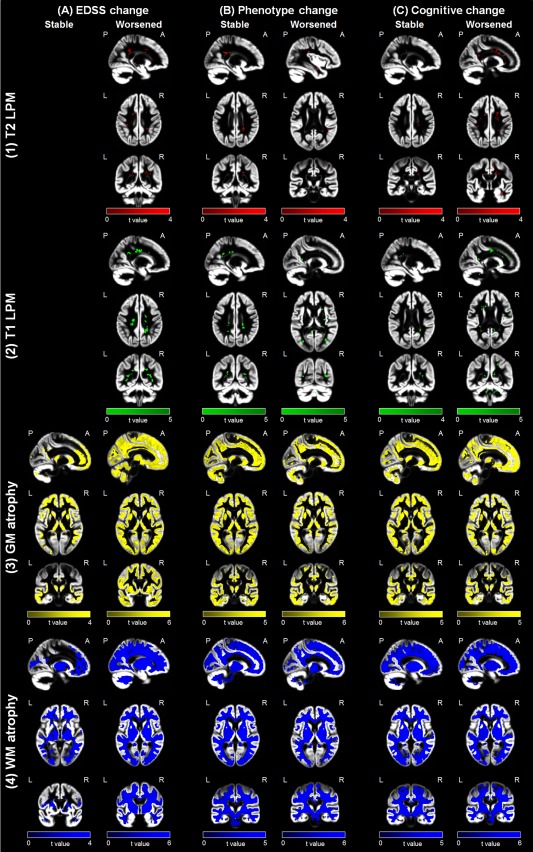
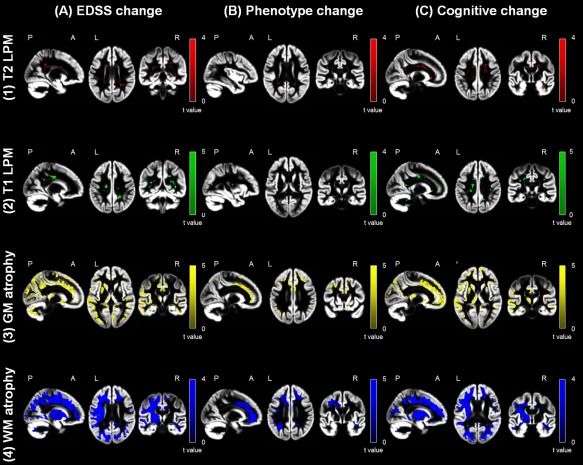
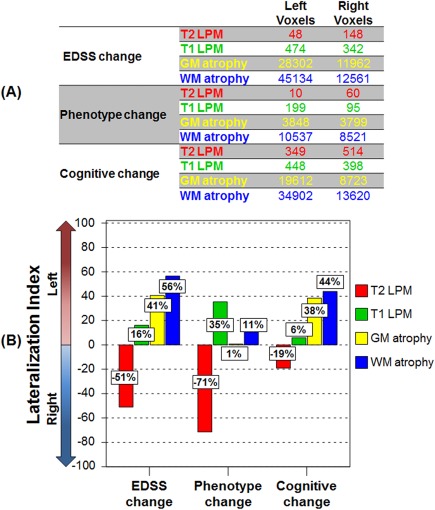
In this longitudinal study, we investigated the regional patterns of focal lesions accumulation, and gray (GM) and white matter (WM) atrophy progression over a five-year follow-up (FU) in multiple sclerosis (MS) patients and their association with clinical and cognitive deterioration. Neurological, neuropsychological and brain MRI (dual-echo and 3D T1-weighted sequences) assessments were prospectively performed at baseline (T0) and after a median FU of 4.9 years from 66 MS patients (including relapse-onset and primary progressive MS) and 16 matched controls. Lesion probability maps were obtained. Longitudinal changes of GM and WM volumes and their association with clinical and cognitive deterioration were assessed using tensor-based morphometry and SPM12. At FU, 36/66 (54.5%) MS patients showed a significant disability worsening, 14/66 (21.2%) evolved to a worse clinical phenotype, and 18/63 (28.6%) developed cognitive deterioration. At T0, compared to controls, MS patients showed a widespread pattern of GM atrophy, involving cortex, deep GM and cerebellum, and atrophy of the majority of WM tracts, which further progressed at FU (P < 0.001, uncorrected). Compared to stable patients, those with clinical and cognitive worsening showed a left-lateralized pattern of GM and WM atrophy, involving deep GM, fronto-temporo-parieto-occipital regions, cerebellum, and several WM tracts (P < 0.001, uncorrected).GM and WM atrophy of relevant brain regions occur in MS after 5 years. A different vulnerability of the two brain hemispheres to irreversible structural damage may be among the factors contributing to clinical and cognitive worsening in these patients. Hum Brain Mapp 38:5648-5665, 2017. © 2017 Wiley Periodicals, Inc.
Keywords: MRI; atrophy progression; gray matter; multiple sclerosis; white matter.
© 2017 Wiley Periodicals, Inc.
Conflict of interest statement
P. Preziosa received speakers honoraria from Biogen Idec, Novartis, and ExceMED. E. Pagani, S. Mesaros, G.C. Riccitelli, J. Dackovic, and J. Drulovic report no disclosures. M. Filippi serves on a scientific advisory board for Teva Pharmaceutical Industries; has received compensation for consulting services and/or speaking activities from Biogen Idec, ExceMED, Novartis, and Teva Pharmaceutical Industries; and receives research support from Biogen Idec, Teva Pharmaceutical Industries, Novartis, Italian Ministry of Health, Fondazione Italiana Sclerosi Multipla, Cure PSP, Alzheimer's Drug Discovery Foundation (ADDF), the Jacques and Gloria Gossweiler Foundation (Switzerland), and ARiSLA (Fondazione Italiana di Ricerca per la SLA). M.A. Rocca received speakers honoraria from Biogen Idec, Novartis, Genzyme, Sanofi‐Aventis, Teva, and Merk Serono and received research support from the Italian Ministry of Health and Fondazione Italiana Sclerosi Multipla.
Figures
Similar articles
-
Cognitive reserve, cognition, and regional brain damage in MS: A 2 -year longitudinal study.Mult Scler. 2019 Mar;25(3):372-381. doi: 10.1177/1352458517750767. Epub 2018 Jan 5. Mult Scler. 2019. PMID: 29303036
-
Imaging patterns of gray and white matter abnormalities associated with PASAT and SDMT performance in relapsing-remitting multiple sclerosis.Mult Scler. 2019 Feb;25(2):204-216. doi: 10.1177/1352458517743091. Epub 2017 Nov 27. Mult Scler. 2019. PMID: 29173009
-
Single scan quantitative gradient recalled echo MRI for evaluation of tissue damage in lesions and normal appearing gray and white matter in multiple sclerosis.J Magn Reson Imaging. 2019 Feb;49(2):487-498. doi: 10.1002/jmri.26218. Epub 2018 Aug 29. J Magn Reson Imaging. 2019. PMID: 30155934 Free PMC article.
-
Pathology and MRI: exploring cognitive impairment in MS.Acta Neurol Scand. 2016 Sep;134 Suppl 200:24-33. doi: 10.1111/ane.12649. Acta Neurol Scand. 2016. PMID: 27580903 Review.
-
Relationship Between White Matter Lesions and Gray Matter Atrophy in Multiple Sclerosis: A Systematic Review.Neurology. 2022 Apr 12;98(15):e1562-e1573. doi: 10.1212/WNL.0000000000200006. Epub 2022 Feb 16. Neurology. 2022. PMID: 35173016 Free PMC article.
Cited by
-
2.5-Year changes of connectivity dynamism are relevant for physical and cognitive deterioration in multiple sclerosis.Mult Scler. 2024 Apr;30(4-5):546-557. doi: 10.1177/13524585241231155. Epub 2024 Feb 19. Mult Scler. 2024. PMID: 38372039 Free PMC article.
-
Early regional cerebral grey matter damage predicts long-term cognitive impairment phenotypes in multiple sclerosis: a 20-year study.Brain Commun. 2024 Oct 12;6(6):fcae355. doi: 10.1093/braincomms/fcae355. eCollection 2024. Brain Commun. 2024. PMID: 39494361 Free PMC article.
-
Cognitive phenotypes in multiple sclerosis: mapping the spectrum of impairment.J Neurol. 2024 Apr;271(4):1571-1583. doi: 10.1007/s00415-023-12102-5. Epub 2023 Nov 26. J Neurol. 2024. PMID: 38007408
-
Progression of regional grey matter atrophy in multiple sclerosis.Brain. 2018 Jun 1;141(6):1665-1677. doi: 10.1093/brain/awy088. Brain. 2018. PMID: 29741648 Free PMC article.
-
A matter of atrophy: differential impact of brain and spine damage on disability worsening in multiple sclerosis.J Neurol. 2021 Dec;268(12):4698-4706. doi: 10.1007/s00415-021-10576-9. Epub 2021 May 3. J Neurol. 2021. PMID: 33942160 Free PMC article.
References
-
- Amato MP, Portaccio E, Goretti B, Zipoli V, Battaglini M, Bartolozzi ML, Stromillo ML, Guidi L, Siracusa G, Sorbi S, Federico A, De Stefano N (2007): Association of neocortical volume changes with cognitive deterioration in relapsing‐remitting multiple sclerosis. Arch Neurol 64:1157–1161. - PubMed
-
- Ashburner J (2007): A fast diffeomorphic image registration algorithm. NeuroImage 38:95–113. - PubMed
-
- Ashburner J, Friston KJ (2005): Unified segmentation. NeuroImage 26:839–851. - PubMed
Publication types
MeSH terms
LinkOut - more resources
Full Text Sources
Other Literature Sources
Medical
