

Intrinsic functional connectivity variance and state-specific under-connectivity in autism
- PMID: 28792117
- PMCID: PMC5783325
- DOI: 10.1002/hbm.23764
Intrinsic functional connectivity variance and state-specific under-connectivity in autism
Abstract
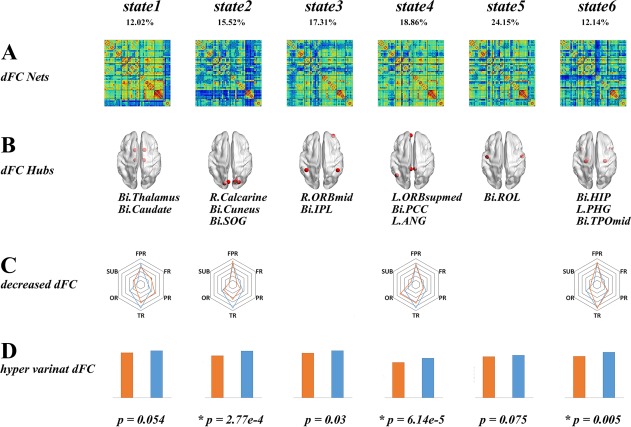
Autism spectrum disorder (ASD) is a neurodevelopmental condition associated with altered brain connectivity. Previous neuroimaging research demonstrates inconsistent results, particularly in studies of functional connectivity in ASD. Typically, these inconsistent findings are results of studies using static measures of resting-state functional connectivity. Recent work has demonstrated that functional brain connections are dynamic, suggesting that static connectivity metrics fail to capture nuanced time-varying properties of functional connections in the brain. Here we used a dynamic functional connectivity approach to examine the differences in the strength and variance of dynamic functional connections between individuals with ASD and healthy controls (HCs). The variance of dynamic functional connections was defined as the respective standard deviations of the dynamic functional connectivity strength across time. We utilized a large multicenter dataset of 507 male subjects (209 with ASD and 298 HC, from 6 to 36 years old) from the Autism Brain Imaging Data Exchange (ABIDE) to identify six distinct whole-brain dynamic functional connectivity states. Analyses demonstrated greater variance of widespread long-range dynamic functional connections in ASD (P < 0.05, NBS method) and weaker dynamic functional connections in ASD (P < 0.05, NBS method) within specific whole-brain connectivity states. Hypervariant dynamic connections were also characterized by weaker connectivity strength in ASD compared with HC. Increased variance of dynamic functional connections was also related to ASD symptom severity (ADOS total score) (P < 0.05), and was most prominent in connections related to the medial superior frontal gyrus and temporal pole. These results demonstrate that greater intraindividual dynamic variance is a potential biomarker of ASD. Hum Brain Mapp 38:5740-5755, 2017. © 2017 Wiley Periodicals, Inc.
Keywords: autism spectrum disorder; dynamic functional connectivity; intraindividual variance; state-specific under-connectivity.
© 2017 Wiley Periodicals, Inc.
Conflict of interest statement
All authors declared no conflicts of interest.
Figures


Similar articles
-
Dynamic Functional Connectivity Reveals Abnormal Variability and Hyper-connected Pattern in Autism Spectrum Disorder.Autism Res. 2020 Feb;13(2):230-243. doi: 10.1002/aur.2212. Epub 2019 Oct 15. Autism Res. 2020. PMID: 31614075
-
Dynamic functional connectivity analysis reveals decreased variability of the default-mode network in developing autistic brain.Autism Res. 2018 Nov;11(11):1479-1493. doi: 10.1002/aur.2020. Epub 2018 Oct 1. Autism Res. 2018. PMID: 30270547
-
Aberrant "deep connectivity" in autism: A cortico-subcortical functional connectivity magnetic resonance imaging study.Autism Res. 2019 Mar;12(3):384-400. doi: 10.1002/aur.2058. Epub 2019 Jan 9. Autism Res. 2019. PMID: 30624021
-
Neuroimaging in neurodevelopmental disorders: focus on resting-state fMRI analysis of intrinsic functional brain connectivity.Curr Opin Neurol. 2018 Apr;31(2):140-148. doi: 10.1097/WCO.0000000000000536. Curr Opin Neurol. 2018. PMID: 29351108 Review.
-
Altered resting-state dynamics in autism spectrum disorder: Causal to the social impairment?Prog Neuropsychopharmacol Biol Psychiatry. 2019 Mar 2;90:28-36. doi: 10.1016/j.pnpbp.2018.11.002. Epub 2018 Nov 7. Prog Neuropsychopharmacol Biol Psychiatry. 2019. PMID: 30414457 Review.
Cited by
-
Deep learning based joint fusion approach to exploit anatomical and functional brain information in autism spectrum disorders.Brain Inform. 2024 Jan 9;11(1):2. doi: 10.1186/s40708-023-00217-4. Brain Inform. 2024. PMID: 38194126 Free PMC article.
-
Evaluation of Differences in Temporal Synchrony Between Brain Regions in Individuals With Autism and Typical Development.JAMA Netw Open. 2018 Nov 2;1(7):e184777. doi: 10.1001/jamanetworkopen.2018.4777. JAMA Netw Open. 2018. PMID: 30646371 Free PMC article.
-
Quantifying individual differences in brain morphometry underlying symptom severity in Autism Spectrum Disorders.Sci Rep. 2019 Jul 9;9(1):9898. doi: 10.1038/s41598-019-45774-z. Sci Rep. 2019. PMID: 31289283 Free PMC article.
-
Dynamic functional network reconfiguration underlying the pathophysiology of schizophrenia and autism spectrum disorder.Hum Brain Mapp. 2021 Jan;42(1):80-94. doi: 10.1002/hbm.25205. Epub 2020 Sep 23. Hum Brain Mapp. 2021. PMID: 32965740 Free PMC article.
-
Alteration of resting-state network dynamics in autism spectrum disorder based on leading eigenvector dynamics analysis.Front Integr Neurosci. 2023 Jan 19;16:922577. doi: 10.3389/fnint.2022.922577. eCollection 2022. Front Integr Neurosci. 2023. PMID: 36743477 Free PMC article.
References
-
- American Psychiatric Association . (2013): The Diagnostic and Statistical Manual of Mental Disorders: DSM 5. USA: Bookpoint; p 991.
Publication types
MeSH terms
Grants and funding
LinkOut - more resources
Full Text Sources
Other Literature Sources
Medical
Research Materials
Miscellaneous
