. 2017 Oct;143(2):198-213.
doi: 10.1111/jnc.14143. Epub 2017 Sep 21.

Corticosterone and exogenous glucose alter blood glucose levels, neurotoxicity, and vascular toxicity produced by methamphetamine

Affiliations

Corticosterone and exogenous glucose alter blood glucose levels, neurotoxicity, and vascular toxicity produced by methamphetamine

John F Bowyer et al. J Neurochem. 2017 Oct.

Abstract

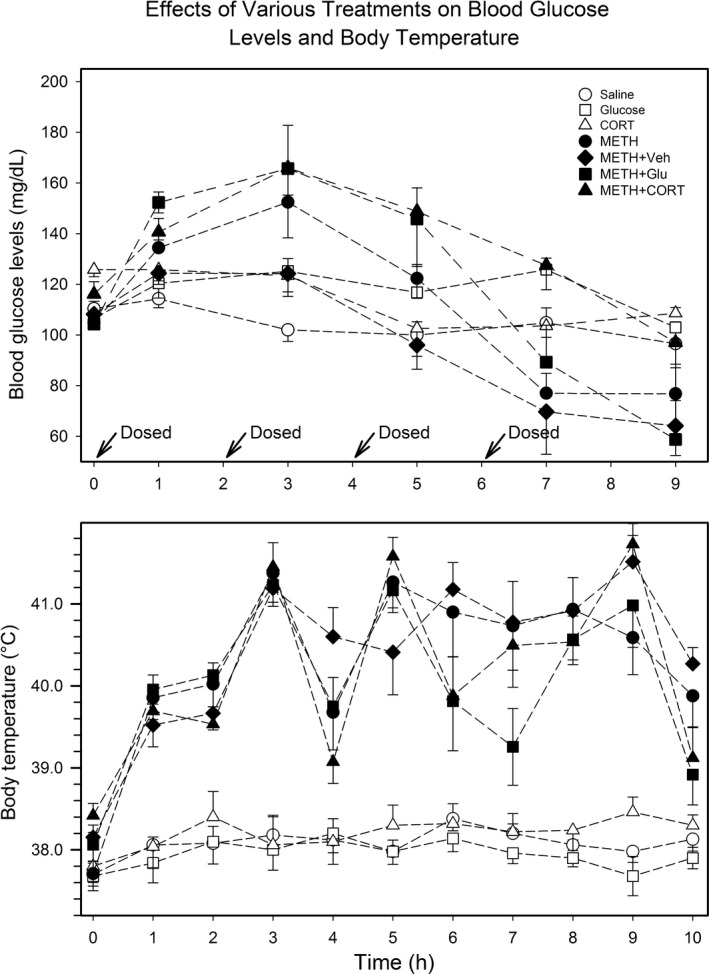
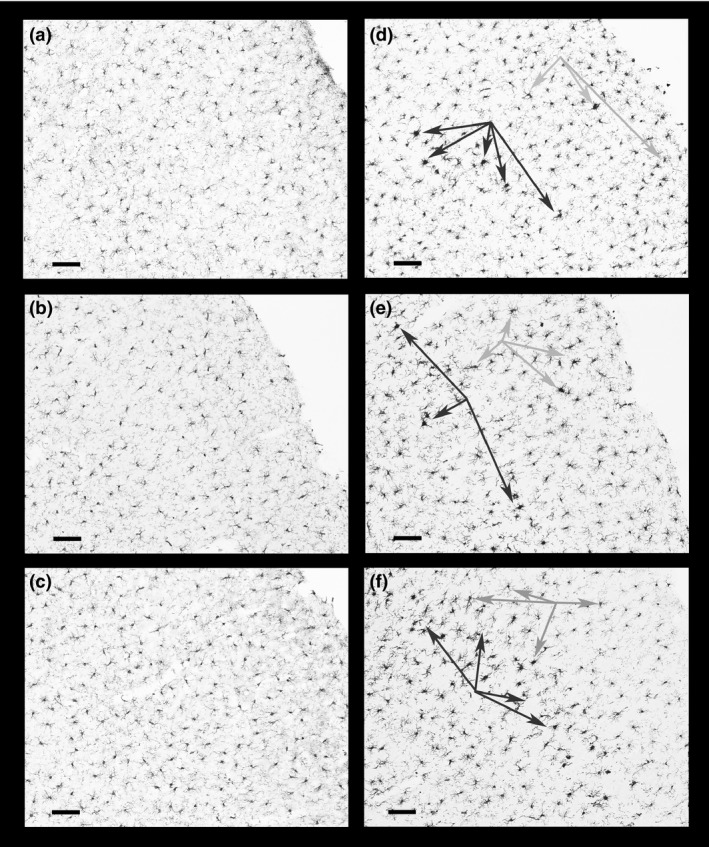
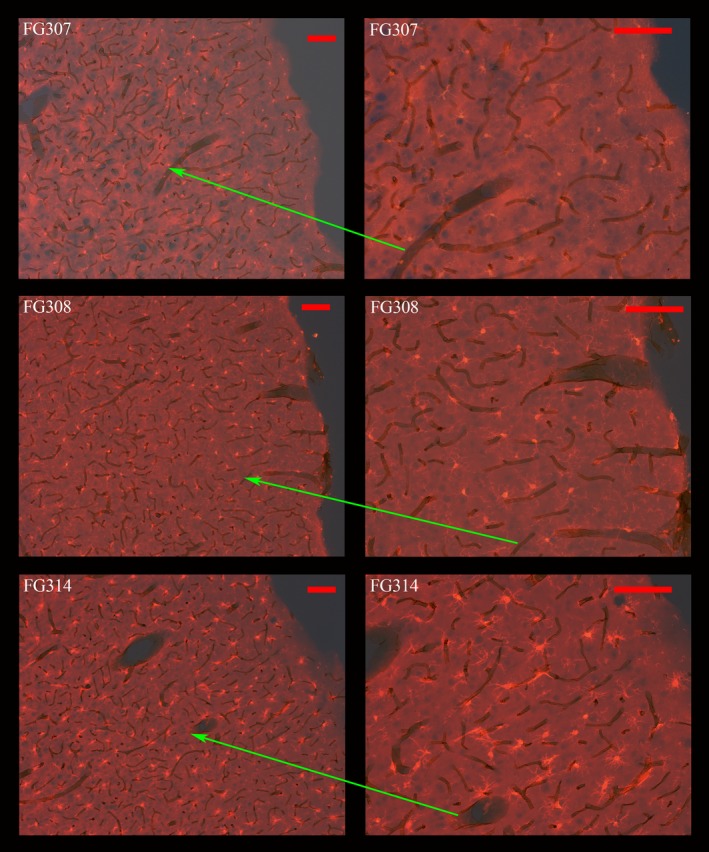
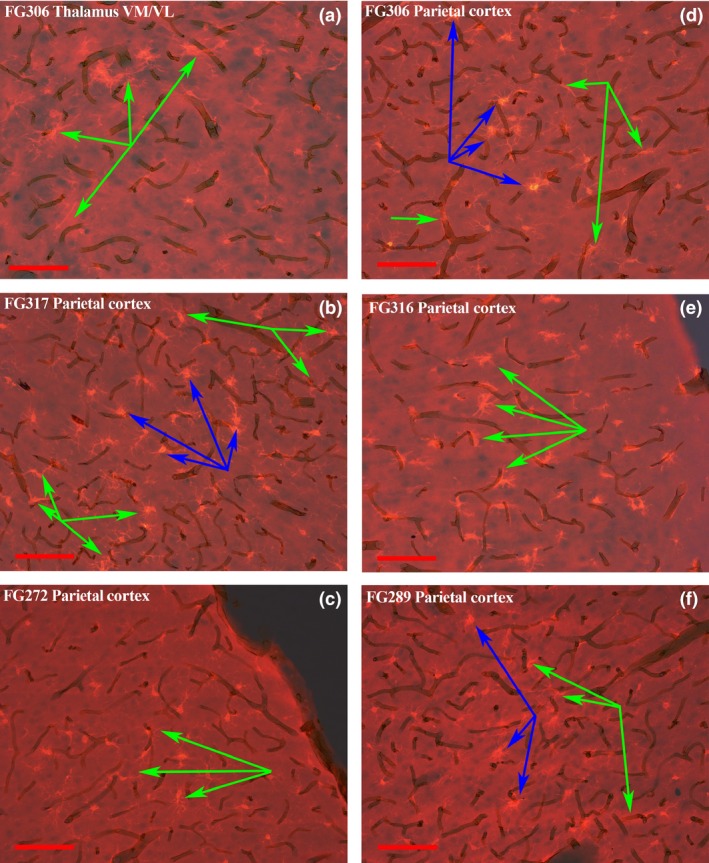
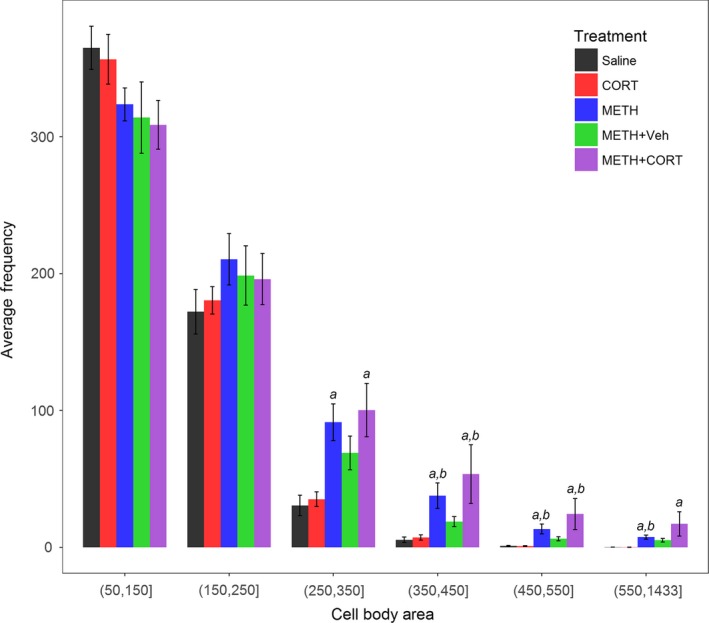
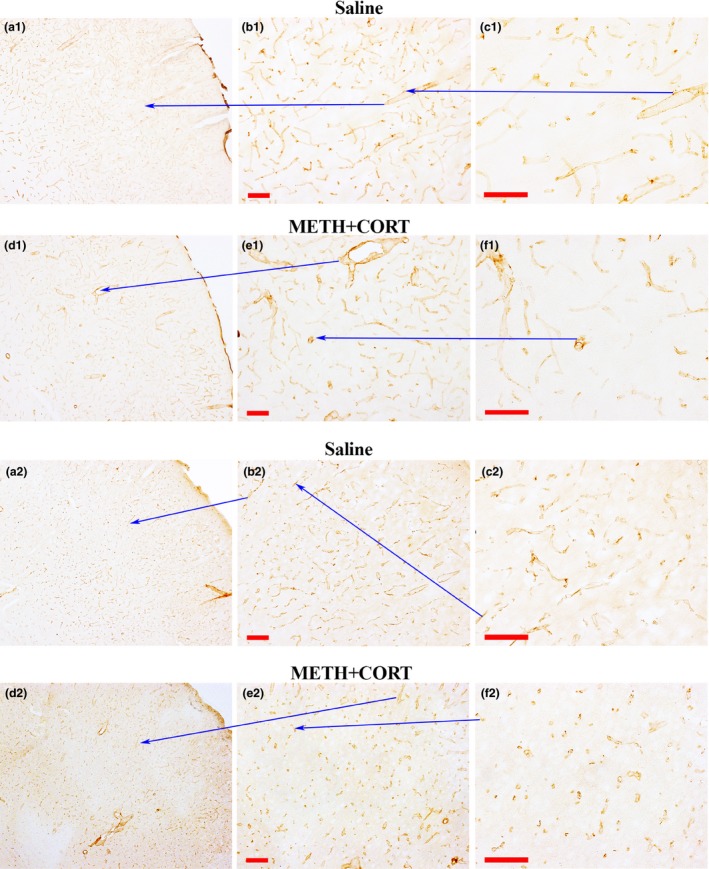
Our previous studies have raised the possibility that altered blood glucose levels may influence and/or be predictive of methamphetamine (METH) neurotoxicity. This study evaluated the effects of exogenous glucose and corticosterone (CORT) pretreatment alone or in combination with METH on blood glucose levels and the neural and vascular toxicity produced. METH exposure consisted of four sequential injections of 5, 7.5, 10, and 10 mg/kg (2 h between injections) D-METH. The three groups given METH in combination with saline, glucose (METH+Glucose), or CORT (METH+CORT) had significantly higher glucose levels compared to the corresponding treatment groups without METH except at 3 h after the last injection. At this last time point, the METH and METH+Glucose groups had lower levels than the non-METH groups, while the METH+CORT group did not. CORT alone or glucose alone did not significantly increase blood glucose. Mortality rates for the METH+CORT (40%) and METH+Glucose (44%) groups were substantially higher than the METH (< 10%) group. Additionally, METH+CORT significantly increased neurodegeneration above the other three METH treatment groups (≈ 2.5-fold in the parietal cortex). Thus, maintaining elevated levels of glucose during METH exposure increases lethality and may exacerbate neurodegeneration. Neuroinflammation, specifically microglial activation, was associated with degenerating neurons in the parietal cortex and thalamus after METH exposure. The activated microglia in the parietal cortex were surrounding vasculature in most cases and the extent of microglial activation was exacerbated by CORT pretreatment. Our findings show that acute CORT exposure and elevated blood glucose levels can exacerbate METH-induced vascular damage, neuroinflammation, neurodegeneration and lethality. Cover Image for this issue: doi. 10.1111/jnc.13819.

Keywords: amphetamine; blood glucose; corticosterone; methamphetamine; neurotoxicity; vascular damage.


Figures

Figure 1
Figure 1
Blood glucose levels and body temperature at 3 h post‐ dosing. The blood glucose levels (top panel) and body temperature (bottom panel) are shown for all seven treatment groups. Blood glucose was determined 1 h after each of injection of METH and also at 3 h after the last set injection from blood obtained from the hindfoot toe pad. Upper colonic temperature was determined every hour.
Figure 2
Figure 2
Microglial activation in the parietal cortex. Activated microglia often associated with degenerating neurons, located in the barrel fields of primary somatosensory cortex layer III, are identified by the dark arrows in panels (d) (METH), (e) (METH+Glucose) and (f) (METH+CORT) and can be compared to the absence of activated microglia in panels (a) (Saline) and (b) (Glucose). There is a hint of slight microglial activation in layer III of the CORT group (panel c). Fewer numbers of such activated microglia can also be seen in cortical layers II and IV as indicated by the gray arrows. Magnification bar (bottom left on panels) = 100 μm.
Figure 3
Figure 3
Co‐localization of activated microglia and vasculature in the parietal cortex. The photomicrographs panels were formed by merging the visible light images with the fluorescent images of sections dual labeled with 3,3'‐diaminobenzidine (DAB)‐RECA1 antibody and TRITC‐Iba1‐antibody. Bright red TRITC labeled microglia in layers I through III can be seen in a Saline animal (FG307) at two magnifications (top two panels). In the middle two panels, slightly larger microglia can be seen in the same cortical regions in an animal from the CORT group (FG308). Finally, in the bottom two panels, activated microglia in an animal from the METH+Glucose group (FG314) can be seen from cortical layer III all the way into the lower portions of layer I. The ends of the red arrows identify the identical region at higher magnification. Magnification bar = 100 μm.
Figure 4
Figure 4
Co‐localization of activated microglia and vasculature in the parietal cortex after METH+CORT. The photomicrographs panels were formed in the same manner as those in Fig. 3. Activated microglia associated with vasculature, identified by the green arrows, are present at the border of the ventrolateral and ventromedial thalamus in panel (a). This panel was from a micrograph of an animal from the METH+CORT group, as are all the other panels in this figure. The micrographs in panels (b) through (f) show activated microglia, identified by the blue arrows, in association with vasculature in layers II and IV of the parietal cortex in regions where there is minimal or no FJc labeling/neurodegeneration. Magnification bar = 100 μm.
Figure 5
Figure 5
Bar plot of microglia in the parietal cortex after treatment. Average number and SEM of microglia categorized by microglial area (soma + adjoining proximal processes) in Saline, CORT, METH, METH+Veh and METH+CORT treatment groups. anumbers significantly greater than Saline at p < 0.05 as adjusted for multiple comparisons. bnumbers significantly greater than CORT at p < 0.05 as adjusted for multiple comparisons.
Figure 6
Figure 6
Collagen IV and Glut‐1 depletions in the vasculature of the parietal cortex after METH+CORT. Collagen IV immune‐labeling in the S1/S2 somatosensory barrel fields of the cortex are shown at three different magnifications (a1, b1 and c1) at 3 days post‐saline. METH+CORT cause decreased labeling in this region (d1, e1, and f1) as shown at the same magnification levels. Likewise, compared to Saline at several magnification (a2, b2, and c2), the METH+CORT exposure resulted in some depletion of the Glut‐1 transporter (d2, e2, and f2) and some moderate changes in vascular distribution in the same region of the parietal cortex. Magnification bar = 100 μm.

References

    1. Abdul Muneer P. M., Alikunju S., Szlachetka A. M. and Haorah J. (2011a) Methamphetamine inhibits the glucose uptake by human neurons and astrocytes: stabilization by acetyl‐L‐carnitine. PloS one 6, e19258. - PMC - PubMed
    1. Abdul Muneer P. M., Alikunju S., Szlachetka A. M., Murrin L. C. and Haorah J. (2011b) Impairment of brain endothelial glucose transporter by methamphetamine causes blood‐brain barrier dysfunction. Mol Neurodegener 6, 23. - PMC - PubMed
    1. Abreu B. E., Liddle G. W. et al (1949) Influence of amphetamine sulfate on cerebral metabolism and blood flow in man. J. Am. Pharm. Assoc. Am. Pharm. Assoc. 38, 186–188. - PubMed
    1. Berntman L., Carlsson C., Hagerdal M. and Siesjo B. K. (1978) Circulatory and metabolic effects in the brain induced by amphetamine sulphate. Acta Physiol. Scand. 102, 310–323. - PubMed
    1. Block M. L., Zecca L. and Hong J. S. (2007) Microglia‐mediated neurotoxicity: uncovering the molecular mechanisms. Nat. Rev. Neurosci. 8, 57–69. - PubMed

Publication types

MeSH terms