. 2017 Aug 17;548(7667):330-333.
doi: 10.1038/nature23299. Epub 2017 Aug 9.

Rewiring the taste system

Affiliations

Rewiring the taste system

Hojoon Lee et al. Nature. .

Abstract

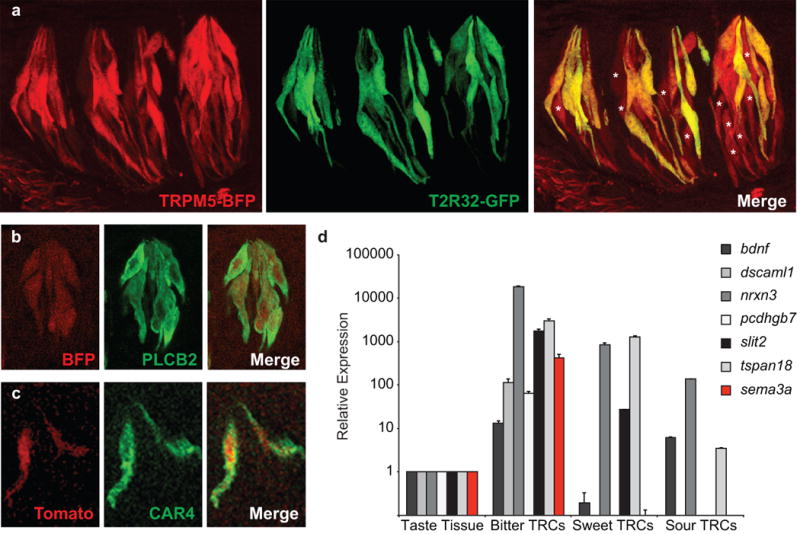
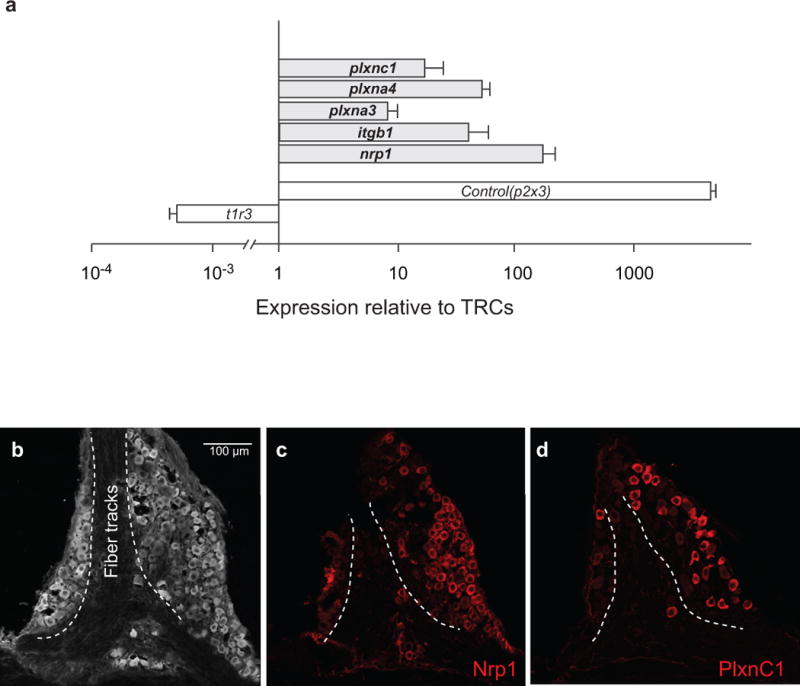
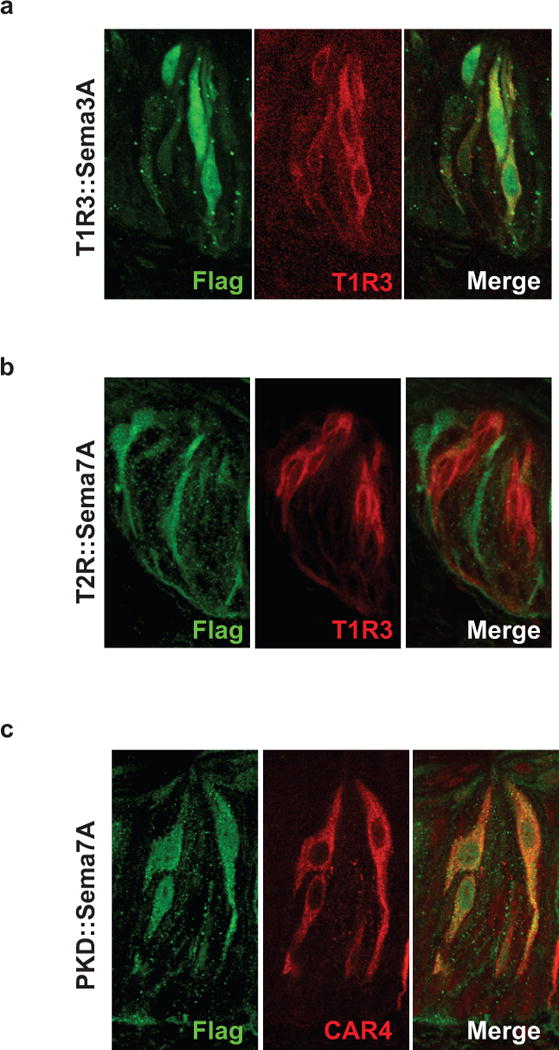
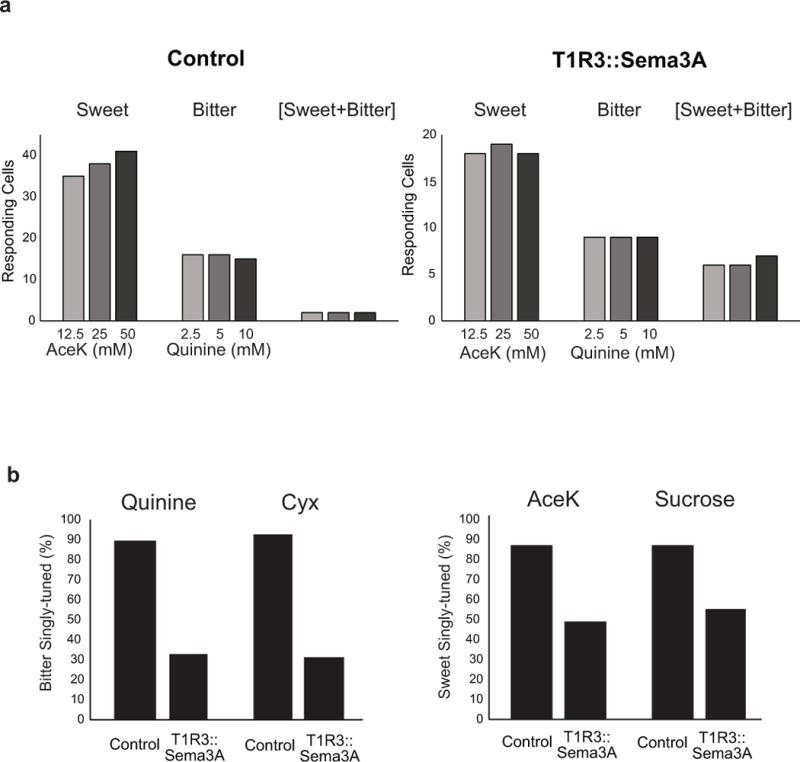
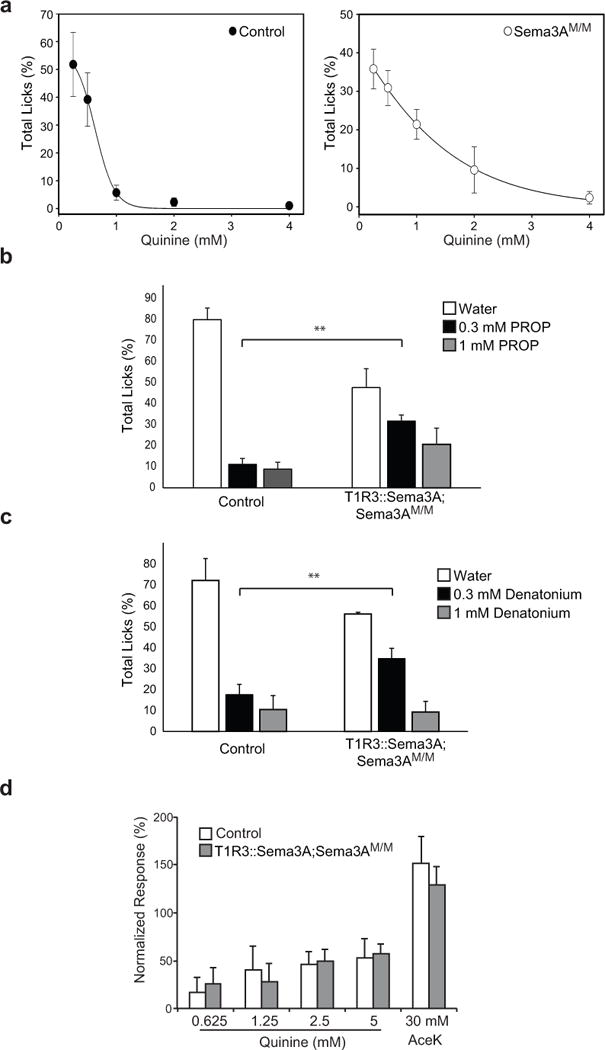
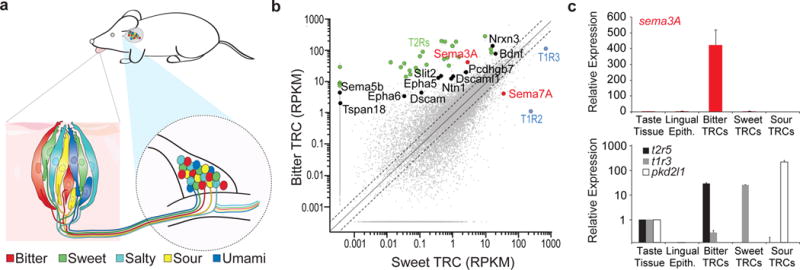
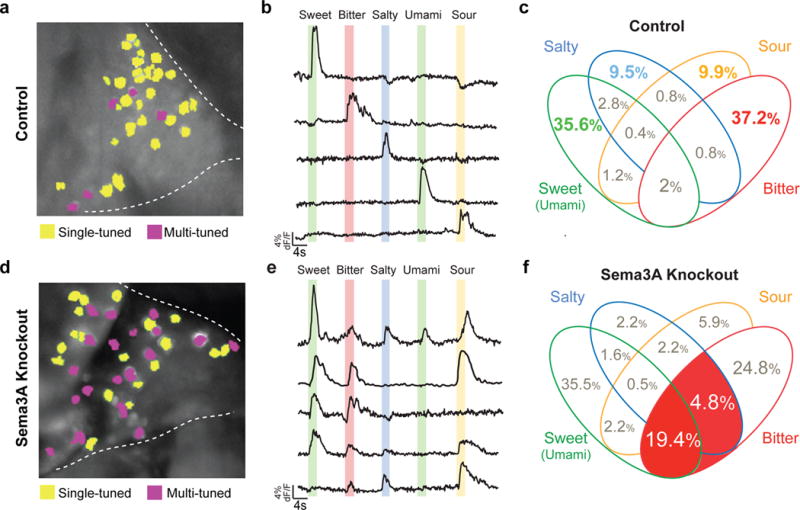
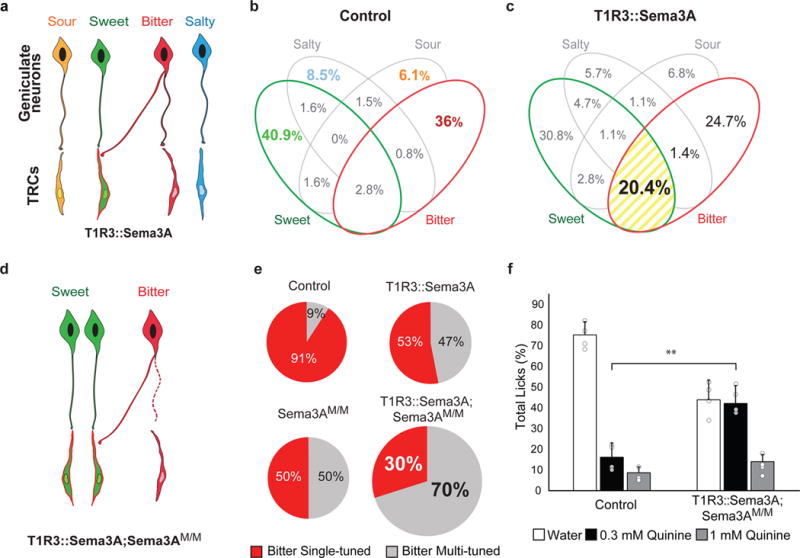
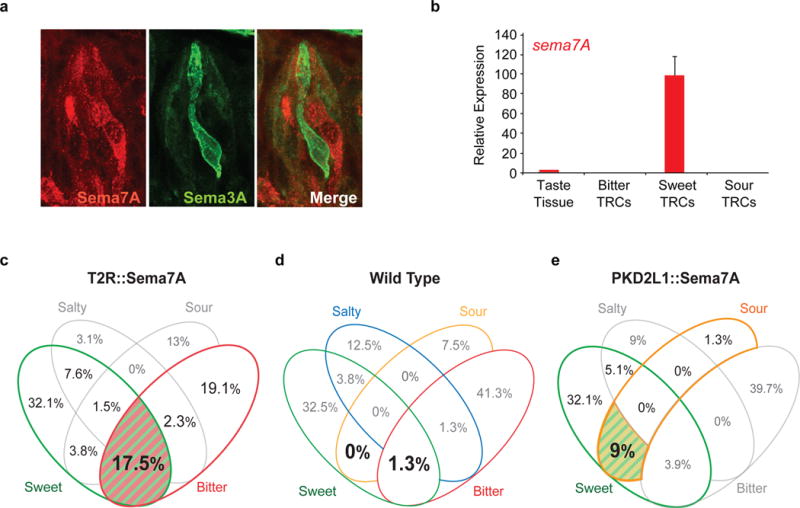
In mammals, taste buds typically contain 50-100 tightly packed taste-receptor cells (TRCs), representing all five basic qualities: sweet, sour, bitter, salty and umami. Notably, mature taste cells have life spans of only 5-20 days and, consequently, are constantly replenished by differentiation of taste stem cells. Given the importance of establishing and maintaining appropriate connectivity between TRCs and their partner ganglion neurons (that is, ensuring that a labelled line from sweet TRCs connects to sweet neurons, bitter TRCs to bitter neurons, sour to sour, and so on), we examined how new connections are specified to retain fidelity of signal transmission. Here we show that bitter and sweet TRCs provide instructive signals to bitter and sweet target neurons via different guidance molecules (SEMA3A and SEMA7A). We demonstrate that targeted expression of SEMA3A or SEMA7A in different classes of TRCs produces peripheral taste systems with miswired sweet or bitter cells. Indeed, we engineered mice with bitter neurons that now responded to sweet tastants, sweet neurons that responded to bitter or sweet neurons responding to sour stimuli. Together, these results uncover the basic logic of the wiring of the taste system at the periphery, and illustrate how a labelled-line sensory circuit preserves signalling integrity despite rapid and stochastic turnover of receptor cells.


Conflict of interest statement

The authors declare no competing financial interests.

Figures

Extended Data Figure 1
Extended Data Figure 1. Expression profiling of fluorescently labeled TRC populations identifies candidate signaling molecules enriched in bitter TRCs
a, Confocal microscopy images of circumvallate papilla (CV) taste buds from a TRPM5-BFP (labeling sweet and bitter TRCs, pseudo-colored red); T2R32-GFP (labeling bitter TRCs) double-labeled transgenic mouse. These are the animals used in the profiling of sweet/umami and bitter TRCs. Note the expected co-expression of bitter taste receptors and a subset of TRPM5-positive cells (right panel; TRPM5-positive but T2R-negative TRCs are indicated by stars). b, Taste bud from a TRPM5-BFP transgenic mouse showing co-expression of the BFP reporter (pseudo-colored red) and PLCβ2 (a marker of sweet, umami, and bitter TRCs, green). c, Taste bud from a PKD2L1-TdTomato transgenic animal demonstrating expression of the TdTomato reporter (red) in sour TRCs (marked by CAR4, green). d, Quantitative RT-PCR illustrating the relative expression of several candidate connectivity molecules in bitter, sweet, and sour TRCs. Data are presented as mean + s.e.m. relative to the expression levels in the whole circumvallate papilla (referred to as taste tissue); n=3.
Extended Data Figure 2
Extended Data Figure 2. Expression of Semaphorin receptors in geniculate ganglion neurons
a, Quantitative RT-PCR analysis showing expression of candidate Sema3A receptors, (Nrp1, PlxnA3, and PlxnA4) and Sema7A receptors, (Itgb1 and PlxnC1) in the geniculate ganglia. P2x3 and T1r3 were used as controls for geniculate ganglia and TRC tissue integrity, respectively. Nrp1, Neuropilin 1; PlxnA3, Plexin A3; PlxnA4, Plexin A4; Itgb1, Integrin β1; PlxnC1, Plexin C1. Data are presented for each gene as its relative abundance in the ganglia compared with TRCs. Values are mean + s.e.m. (n = 3). b-d, Confocal microscopy images of immunostains illustrating the expression of Nrp1 (c) and PlxnC1 (d) in subsets of geniculate ganglion neurons. Panel b depicts the anatomy of the ganglion highlighting the location of fiber tracks.
Extended Data Figure 3
Extended Data Figure 3. Targeted mis-expression of Sema3A and sema7A
a, Confocal microscopy images of circumvallate papilla (CV) taste buds from a T1R3::Sema3A mouse demonstrating transgene expression (marked by Flag tag; green) in T1R3-expressing TRCs (red). b, The Sema7A transgene of T2R::Sema7A animals (green) is expressed in a subset of TRCs not overlapping with T1R3 (red). c, Sema 7A (green) in PKD2L1::Sema7A animals is expressed in sour TRCs (marked by CAR4, red).
Extended Data Figure 4
Extended Data Figure 4. Responses of ganglion neurons in T1R3::Sema3A mice
a, Dose responses to sweet and bitter in control and T1R3::Sema3A mice. Shown are the number of cells responding at each stimulus concentration, classified by their response profile (i.e. sweet-responding, bitter-responding, or sweet-bitter responding). Note that the tuning profiles are maintained at all three sweet and bitter concentrations, including extremely high concentrations of bitter and sweet. Control, n = 58 cells; T1R3::Sema3A, n = 34 cells. b, Responses are similar for different tastants within a modality. Shown are tuning properties of bitter and sweet responding neurons in the T1R3:: Sema3A animals to two structurally different bitter and sweet tasting chemicals. Quinine (5 mM), cycloheximide (100 μM), AceK (30 mM) and sucrose (300 mM). Control: n = 178 bitter-responding cells, n = 227 sweet-responding cells (7 mice). T1R3::Sema3A, n = 130 bitter-responding cells, n = 165 sweet-responding cells (5 mice).
Extended Data Figure 5
Extended Data Figure 5. Aversion to bitter tastants is impaired in T1R3::Sema3A;Sema3AM/M mice
a, Dose response to the bitter quinine in control and Sema3AM/M mutant mice. Animals were tested using a brief-access lick assay as previously described. Shown are the relative fraction of licks to each concentration of quinine (0.25 mM, 0.5 mM, 1 mM, 2 mM, 4mM). Control n = 4, Sema3AM/M n = 5, mean +/− s.d. b-c, Targeting bitter neurons to sweet TRCs results in a significant loss of bitter taste sensitivity (see also Fig. 3f). b, The graphs show the relative fraction of licks to water and to 2 different concentrations of PROP in control and T1R3::Sema3A;Sema3AM/M animals. c, The graphs show the relative fraction of licks to water and to 2 different concentrations of denatonium in control and T1R3::Sema3A;Sema3AM/M animals. n = 3, mean + s.d., ** P < 0.01, Student’s 2-tailed, unpaired T-test. d, Chorda tympani whole nerve recording in control and T1R3::Sema3A;Sema3AM/M mutant mice. Responses were normalized to 60 mM NaCl (n = 3, mean + s.d.). Note that whole nerve responses to bitter and sweet are unchanged, likely as nerve recording measure bulk neural activity, further highlighting the importance of recording single-neuron activity; GCaMP-based imaging of ganglion activity is significantly more informative than whole-nerve, or even single-fiber physiological recordings, as it allows simultaneous sampling of large numbers of neurons with single-cell selectivity.
Figure 1
Figure 1. Sema3A is expressed in bitter TRCs
a, Anatomy of the taste system at the periphery. The lower insets illustrate the labeled-lines connecting the different TRCs in a fungiform papillae to matching geniculate ganglion neurons. b, RNASeq data plotting the normalized number of reads (RPKM) in bitter TRCs (TRPM5-BFP+;T2R-GFP+ double-labeled cells) versus in sweet/umami TRCs (TRPM5-BFP+;T2R-GFP); see Extended Data Figure 1. Colored dots indicate transcripts of interest, including members of the T2R family of bitter taste receptors (green); T1R2 and T1R3 (blue), and candidate connectivity molecules enriched in bitter TRCs (black). Sema3A and Sema7A are labeled in red. c, Quantitative RT-PCR shows highly selective expression of sema3A in bitter TRCs. Lower panel validates the identity of each FAC-sorted TRC population with dedicated TRC marker genes. Data are presented as mean + s.e.m. relative to the expression levels in the taste tissue (circumvallate papilla); n=3. Expression data for candidate Semaphorin receptors in geniculate ganglion neurons is shown in Extended Data Figure 2.
Figure 2
Figure 2. Removal of Sema3A from bitter TRCs increases the population of multi-tuned bitter geniculate neurons
a, Image of a representative control geniculate ganglion expressing GCaMP6s highlighting neurons responding to a single taste quality (yellow) versus the small number that are multi-tuned (magenta). Dashed lines outline the geniculate ganglion with the facial nerve to bottom. b, Traces from five separate neurons (from a) illustrating the time course and amplitude changes in GCaMP6s signals (dF/F) during taste stimulation: sweet (acesulfame K, 30 mM), bitter (quinine, 5 mM), salty (NaCl, 60 mM), umami (monopotassium glutamate 50 mM + inosine monophosphate 1 mM) and sour (citric acid, 50 mM). Colored bars mark time and duration (2 s) of the stimulus. Note the specificity of the responses to single taste qualities. c, Venn diagram displaying all possible combinations of tuning properties in control mice, with numbers of neurons in each class indicated as % of total. Note that over 90% of all neurons are singly-tuned. Because there are very few umami responding neurons in the mouse geniculate ganglion (see ref. ), we grouped sweet and umami cells in our analysis. Bitter-sour segments are merged as nearly all neurons responding to bitter and sour stimuli represent bitter TRCs that are sensitive to acid; n=13 mice, 254 cells. d-f Corresponding panels from a conditional Sema3A knockout in bitter TRCs (T2R19-Cre; Sema3AFlox/Flox). Note the dramatic increase in bitter multi-tuned neurons (highlighted in red in panel f; n = 5 mice, 186 cells. See also Extended Data Table 1. Fisher’s exact test: P < 0.01 (19.4% vs. 2%) and P < 0.05 (4.8% vs. 0.8%).
Figure 3
Figure 3. Rewiring of bitter geniculate ganglion neurons
a, Directed mis-expression of Sema3A in sweet TRCs targets bitter neurons to sweet TRCs. b-c, Venn diagram displaying ganglion neuron tuning in control (n = 9 mice, 247 cells) and T1R3::Sema 3A animals (n = 6 mice, 270 cells); numbers of neurons in each class are indicated as % of total. Highlighted in yellow is the large increase of bitter/sweet multi-tuned cells (P < 0.01, Fisher’s exact test). d, Directed mis-expression of Sema3A in sweet TRCs of Sema3A mutant animals. e, Pie charts depicting the fraction of singly (red) and multi-tuned (grey) bitter responding neurons in the 4 different genetic backgrounds. Note the dramatic loss of singly tuned bitter cells in the T1R3::Sema3A;Sema3AM/M double mutant (T1R3::Sema3A;Sema3AM/M vs others: P < 0.01, Fisher’s exact test). Data for control and T1R3::Sema3A are from panels b and c, respectively. Sema3AM/M,, n= 9 mice (263 cells), T1R3::Sema3A;Sema3AM/M, n=9 mice (130 cells); see also Extended Data Table 2 and Extended Data Fig.4. f, Animals with bitter neurons re-wired to sweet TRCs exhibit a significant loss of bitter taste sensitivity. Animals were presented with water, 0.3 mM quinine and 1 mM quinine; shown are the relative fraction of licks to each stimuli in mutant and wildtype controls (n = 4; mean + s.d. ; **, P < 0.01, Student’s 2-tailed, unpaired T-test). Unlike controls, the mutant animals failed to distinguish moderate concentrations of bitter from water; see Extended Data Figure 5 for additional bitters.
Figure 4
Figure 4. Rewiring of sweet geniculate ganglion neurons
a, Confocal microscopy images of a taste bud showing expression of Sema7A (red) and Sema3A (marked by Sema3A-cre;Rosa-YFP reporter, green). b, Quantitative RT-PCR demonstrating highly selective expression of sema7A transcripts in sweet TRCs; data are presented as mean + s.e.m, n=3. c-e, Geniculate ganglion responses show that Sema7A directs sweet neuron connectivity. c, Animals expressing Sema7A in bitter cells (T2R::Sema7A; n=7 mice, 131 cells). Sweet-bitter multi-tuned cells are highlighted in color (P < 0.01, Fisher’s exact test). d, Wildtype (n=4 mice, 80 cells). e, Animals expressing Sema7A in sour cells (PKD2L1::Sema7A; n=4 mice, 78 cells). Sweet-sour doubly-tuned cells are highlighted (P < 0.01, Fisher’s exact test). See also Extended Data Table 3.

Comment in

References

    1. Lindemann B. Receptors and transduction in taste. Nature. 2001;413:219–225. - PubMed
    1. Yarmolinsky DA, Zuker CS, Ryba NJP. Common sense about taste: from mammals to insects. Cell. 2009;139:234–244. - PMC - PubMed
    1. Barlow LA, Klein OD. Developing and regenerating a sense of taste. Curr Top Dev Biol. 2015;111:401–419. - PMC - PubMed
    1. Zipursky SL, Sanes JR. Chemoaffinity revisited: dscams, protocadherins, and neural circuit assembly. Cell. 2010;143:343–353. - PubMed
    1. Yoshida Y. Semaphorin signaling in vertebrate neural circuit assembly. Front Mol Neurosci. 2012;5:71. - PMC - PubMed

References for Methods and Extended Data

    1. Oka Y, Butnaru M, von Buchholtz L, Ryba NJP, Zuker CS. High salt recruits aversive taste pathways. Nature. 2013;494:472–475. - PMC - PubMed
    1. Zhang Y, et al. Coding of sweet, bitter, and umami tastes: different receptor cells sharing similar signaling pathways. Cell. 2003;112:293–301. - PubMed
    1. Yarmolinsky DA, et al. Coding and plasticity in the mammalian thermosensory system. Neuron. 2016;92:1079–1092. - PMC - PubMed
    1. Chandrashekar J, et al. The taste of carbonation. Science. 2009;326:443–445. - PMC - PubMed
    1. Vandenbeuch A, et al. Postsynaptic P2X3-containing receptors in gustatory nerve fibres mediate responses to all taste qualities in mice. J Physiol. 2015;593:1113–1125. - PMC - PubMed

Publication types