. 2017 Aug 17;548(7667):338-342.
doi: 10.1038/nature23450. Epub 2017 Aug 9.

m6A mRNA methylation controls T cell homeostasis by targeting the IL-7/STAT5/SOCS pathways

Affiliations

m6A mRNA methylation controls T cell homeostasis by targeting the IL-7/STAT5/SOCS pathways

Hua-Bing Li et al. Nature. .

Abstract

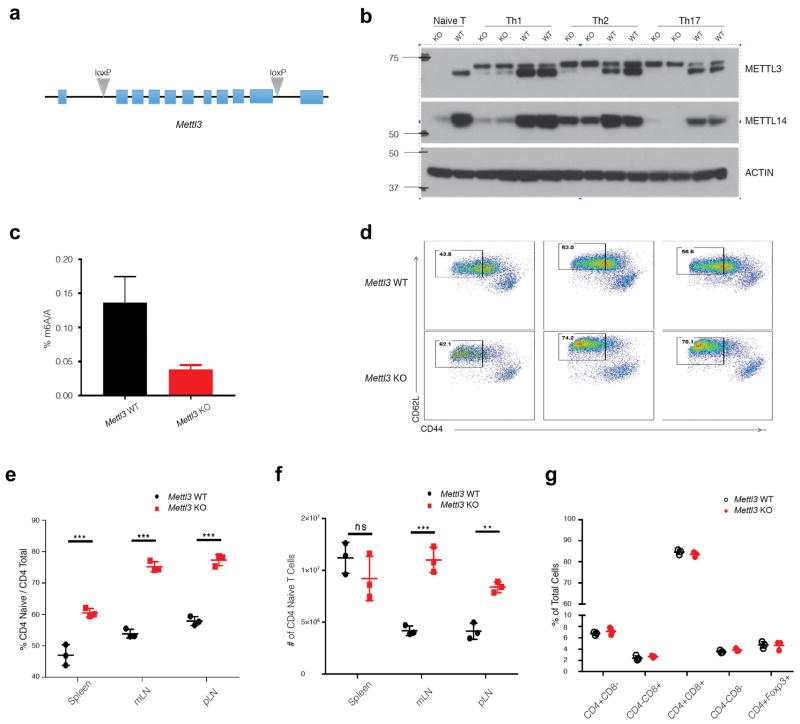
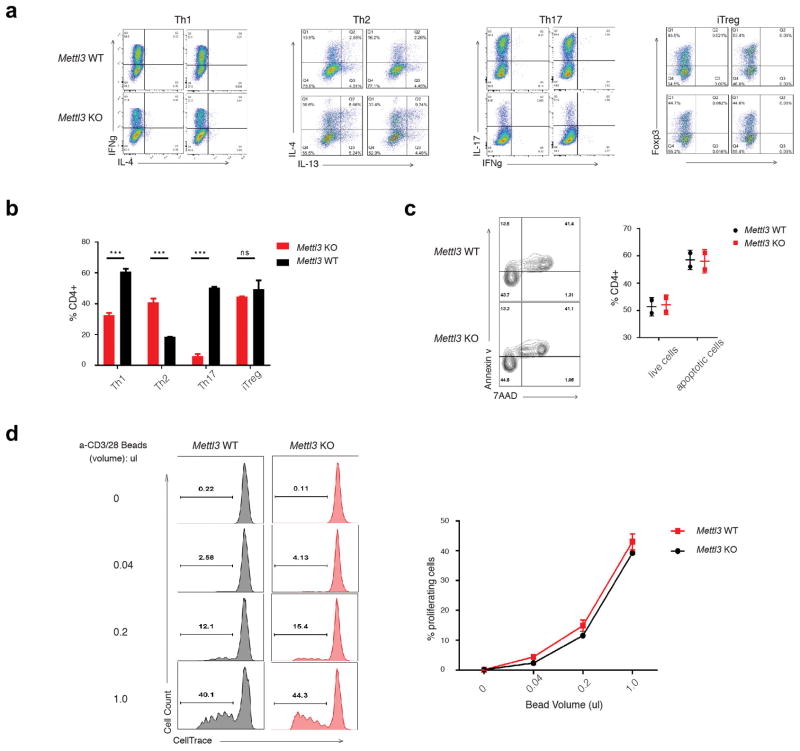
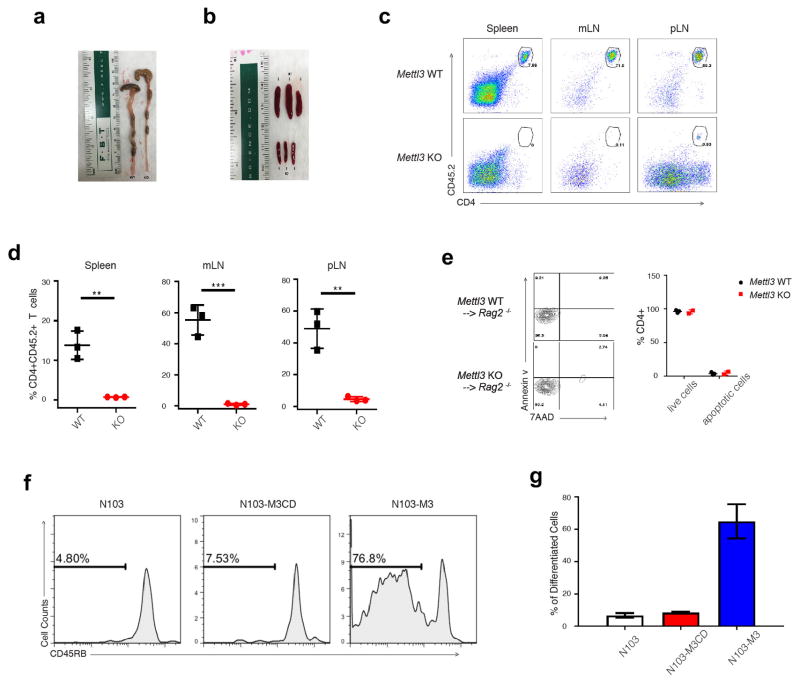
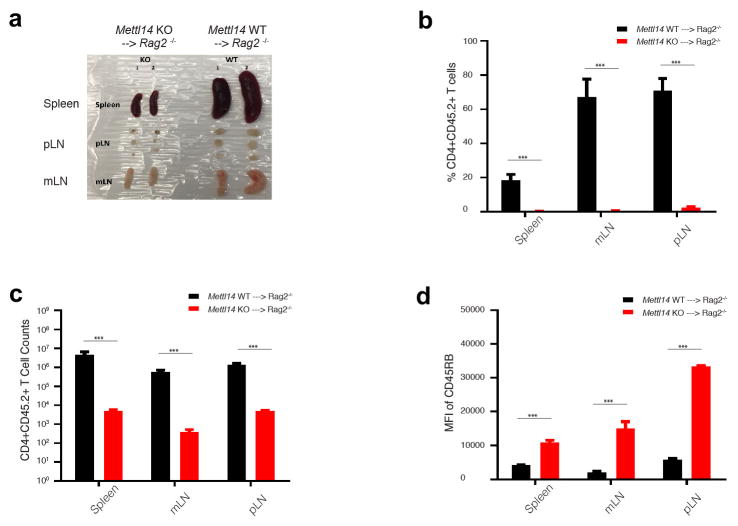
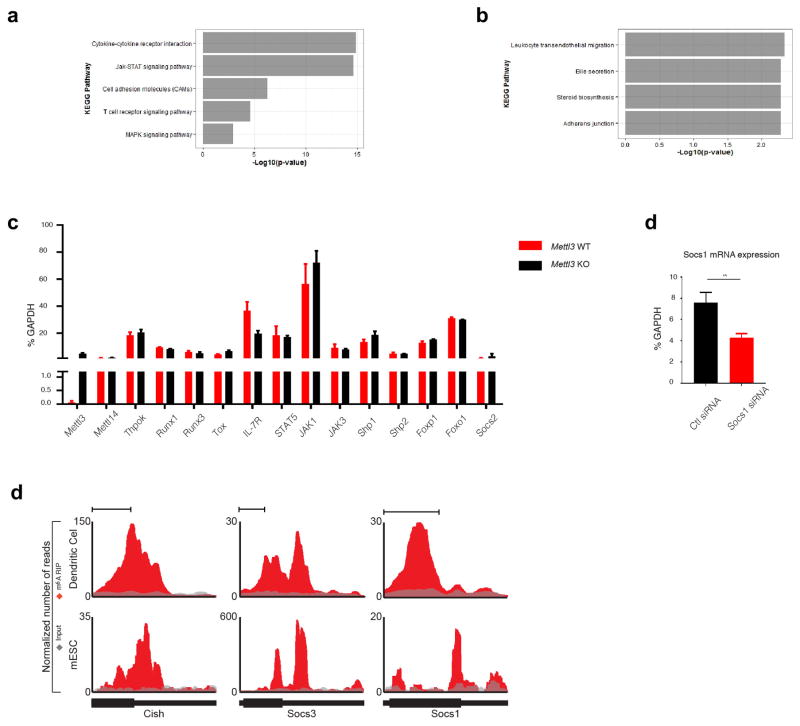
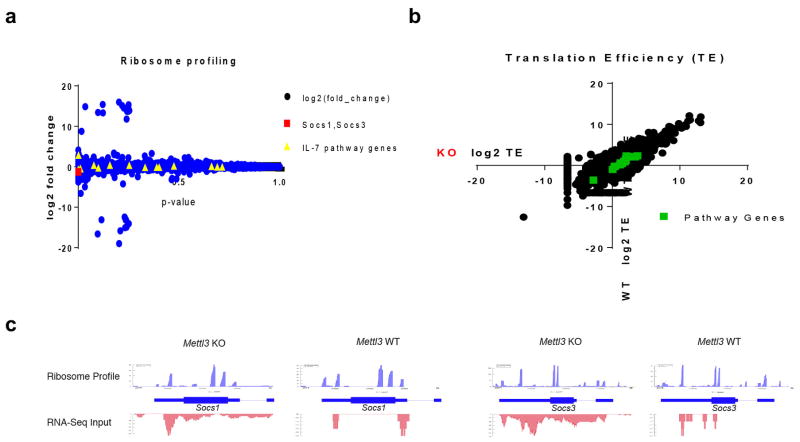
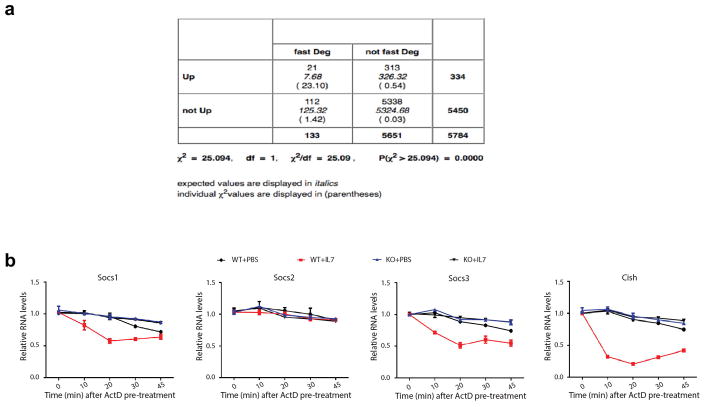
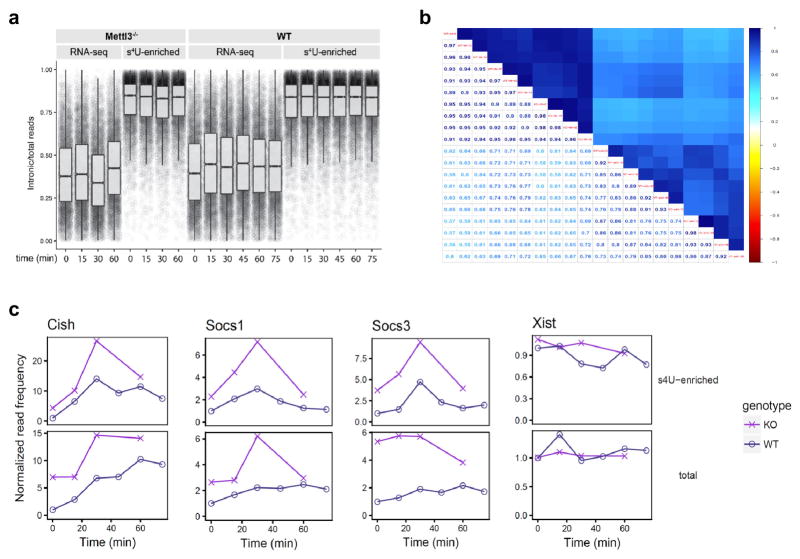
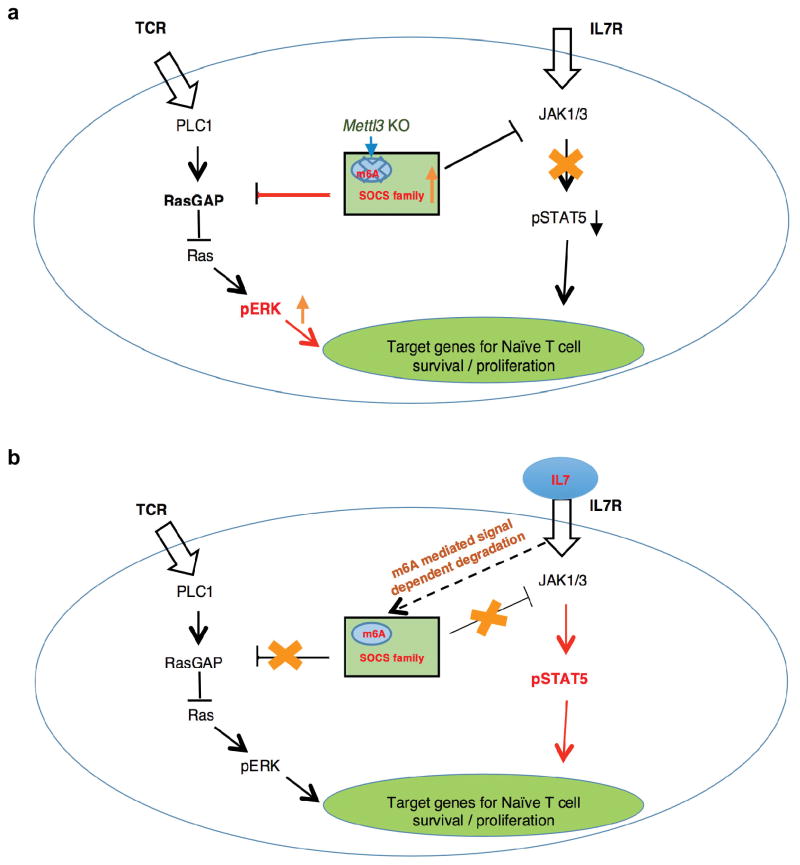
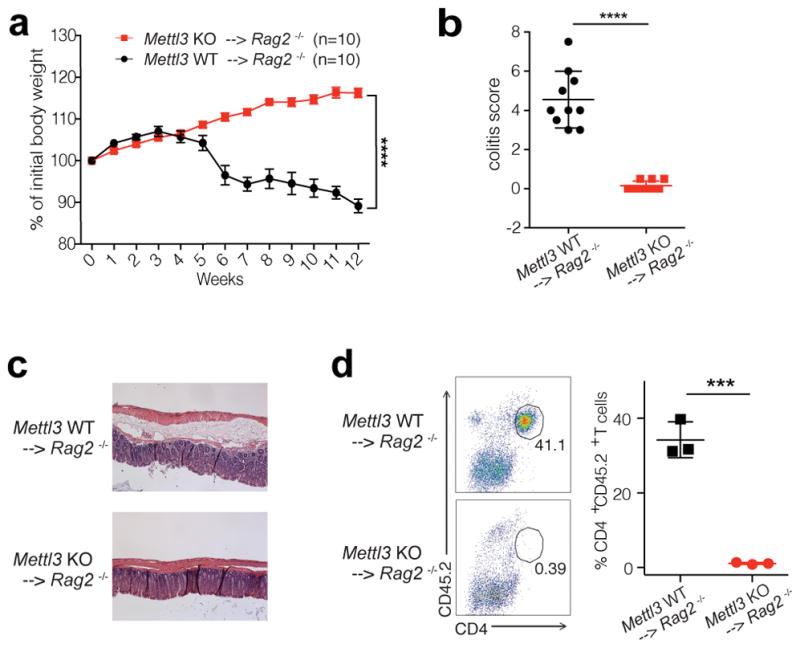
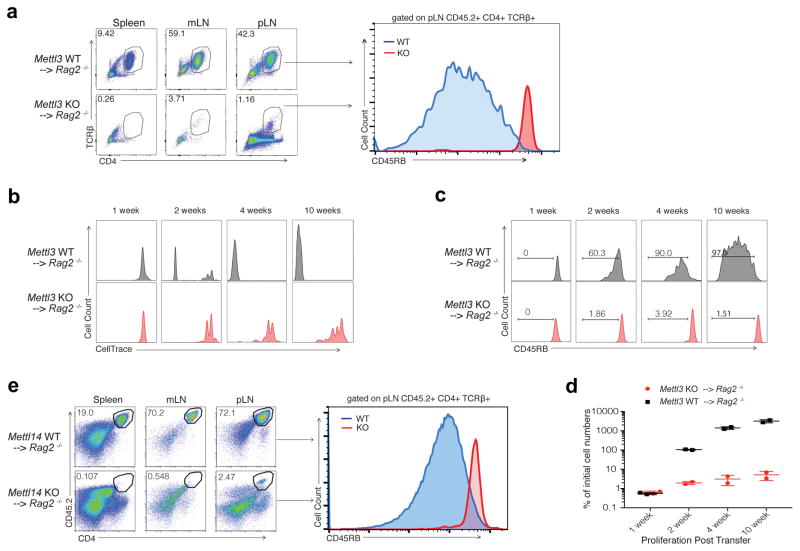
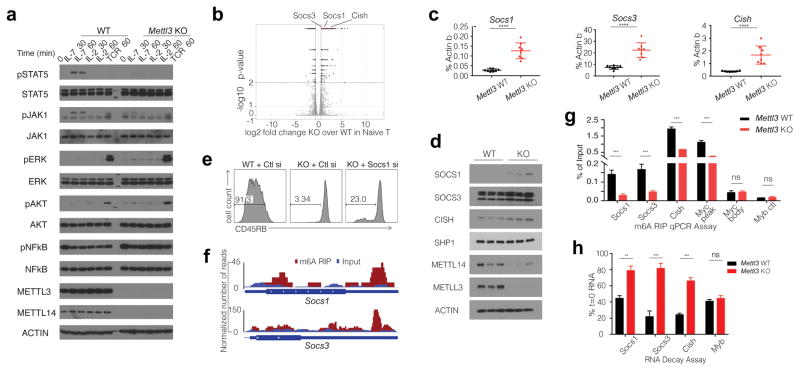
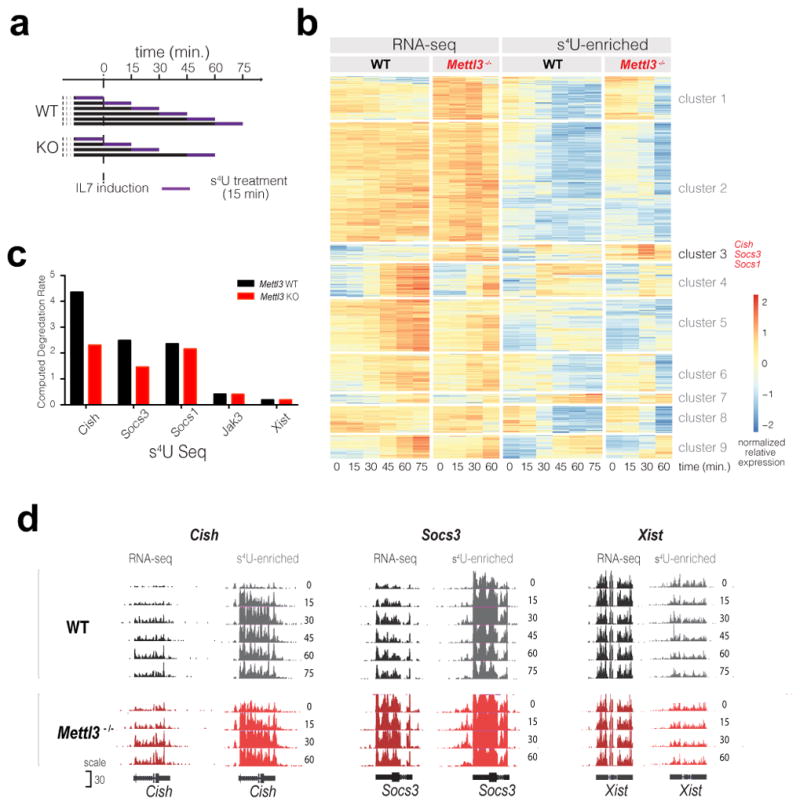
N6-methyladenosine (m6A) is the most common and abundant messenger RNA modification, modulated by 'writers', 'erasers' and 'readers' of this mark. In vitro data have shown that m6A influences all fundamental aspects of mRNA metabolism, mainly mRNA stability, to determine stem cell fates. However, its in vivo physiological function in mammals and adult mammalian cells is still unknown. Here we show that the deletion of m6A 'writer' protein METTL3 in mouse T cells disrupts T cell homeostasis and differentiation. In a lymphopaenic mouse adoptive transfer model, naive Mettl3-deficient T cells failed to undergo homeostatic expansion and remained in the naive state for up to 12 weeks, thereby preventing colitis. Consistent with these observations, the mRNAs of SOCS family genes encoding the STAT signalling inhibitory proteins SOCS1, SOCS3 and CISH were marked by m6A, exhibited slower mRNA decay and showed increased mRNAs and levels of protein expression in Mettl3-deficient naive T cells. This increased SOCS family activity consequently inhibited IL-7-mediated STAT5 activation and T cell homeostatic proliferation and differentiation. We also found that m6A has important roles for inducible degradation of Socs mRNAs in response to IL-7 signalling in order to reprogram naive T cells for proliferation and differentiation. Our study elucidates for the first time, to our knowledge, the in vivo biological role of m6A modification in T-cell-mediated pathogenesis and reveals a novel mechanism of T cell homeostasis and signal-dependent induction of mRNA degradation.


Conflict of interest statement

The authors declare no competing financial interests.

Figures

Extended Data Figure 1
Extended Data Figure 1. Abnormal T cell homeostasis in generated Mettl3 CD4-CRE conditional Knockout mice
a, The two lox sites were inserted into the first and last introns by CRISPR technology. b, Protein levels of METTL3 and its associated METTL14 were analyzed by Western Blot in the naïve T cells and in vitro differentiated Th1, Th2, Th17 cells from Mettl3 KO and WT mice. c, Overall levels of RNA m6A methylation in Naïve T cells from Mettl3 KO and WT mice. d, Naïve T cells increased in all lymphoid organs from Mettl3 KO mice comparing to littermate control WT mice. Cells from spleen (SPL), mesenteric lymph node (mLN), and peripheral lymph node (pLN) were analyzed by FACS by staining with CD4/CD44/CD62L. e, The percentage of CD4+CD44lowCD62+ naïve T cells increased in all three lymphoid organs in Mettl3 KO mice, f, and the total number of naïve T cells in mLN and pLN also increased in KO mice. g, The cell population in the thymus do not have any changes in Mettl3 KO.
Extended Data Figure 2
Extended Data Figure 2. Naïve T cells from Mettl3 KO mice differentiated into less Th1 and Th17 cells, more Th2 cells ex vivo comparing to WT naïve T cells
a, Naïve T cells isolated from Mettl3 WT and KO mice were differentiated into effector subsets under defined optimal conditions. b, The percentages of each T cell subtypes over total CD4+ T cells were analyzed by FACS. c, No apoptosis defects were found in ex vivo cultured cells from WT and Mettl3 KO naïve T cells by FACS staining of Annexin V and 7AAD. Double negative stained cells are live cells, and the remaining are apoptotic cells. The percentage is listed in the right graph. d, No proliferation differences were found in ex vivo cultured cells from WT and Mettl3 KO naïve T cells. Naïve T cells labeled with CellTrace were culture ex vivo under different concentration of Anti-CD3/CD28 beads for 4 days. The percentages of proliferating cells were listed in the right graph.
Extended Data Figure 3
Extended Data Figure 3. m6A methylation function of Mettl3 controls Naïve T cell homeostatic expansion
a, Mettl3−/− receipts had normal colon length, and Mettl3+/+ receipts had shorter colon length. b, Mettl3+/+ receipts had enlarged spleens indicative of normal homeostatic expansion, while Mettl3−/− receipts have very small spleens. c, All lymph organs have much less transferred KO cells comparing to WT cells analyzed by FACS. d, the percentage of transferred Mettl3 KO and WT cells in Rag2−/− host mice. e, No apoptosis defects were found in in vivo cells recovered from peripheral lymph nodes of Mettl3 WT and KO receipt mice by FACS staining of Annexin V and 7AAD. Double negative stained cells are live cells, and the remaining are apoptotic cells. The percentage is listed in the right graph. f–g, WT Mettl3 constructs, but not m6A catalytic dead Mettl3 constructs, could rescue Mettl3 KO in vivo defect phenotypes. Empty construct (N103), catalytic dead Mettl3 construct (N103-CD), and WT Mettl3 construct (N103-M3) were electroporated into Mettl3 KO Naïve T cells, and then transferred into Rag2−/− mice. Four weeks after transfer, the cell number (proliferation) and CD45RB marker (differentiation) were analyzed by FACS, and representative images were shown in f, and the statistics of cell number were shown in g.
Extended Data Figure 4
Extended Data Figure 4. Mettl14 KO naïve T cell adoptive transfer pheno-copies Mettl3 KO cells
a, Mettl14 KO receipt mice have smaller lymphoid organs, including spleen, peripheral lymph nodes, and mesenteric lymph nodes. b–c, The percentage and the number of transferred Mettl14 KO cells in Rag2−/− receipt mice were much less than that of WT cells 4 weeks after transfer in all lymphoid organs. d, The MFI (Median Fluorescence Intensity) of naïve marker CD45RB is much higher in KO than WT, suggesting Mettl14 naïve T cells were locked in naïve state while WT naïve T cells differentiated after 4 weeks in Rag2−/− mice.
Extended Data Figure 5
Extended Data Figure 5. Socs genes are the m6A targets that contribute to the observed phenotypes
a, Up-regulated KEGG pathways in Mettl3 KO cells over WT cells based on RNA-Seq data. b, Down-regulated pathways in Mettl3 KO cells over WT cells. c, RT-qPCR validated the RNA-Seq data that the mRNA expression levels of other genes and regulators in IL-7 pathways did not change in Mettl3 KO naïve T cells comparing to WT cells (n=6). d, Socs1 siRNAs knock down Socs1 gene expression by half in vitro. Naïve T cells were incubated with Socs1 or control siRNA in vitro for 3 days, and RT-qPCR was used to measure the mRNA levels of Socs1 gene. e, Socs1, Socs3 and Cish mRNA 3′ UTRs are enriched with m6A peaks from published ESC and Dendritic Cell m6A-RIP genome mapping. Red denotes the IP RNA counts, and Grey denotes input.
Extended Data Figure 6
Extended Data Figure 6. Ribosome profiling does not reveal any ribosome occupancy differences in IL-7 and TCR signaling related genes
a, Overall statistical analysis for all genes. Socs genes and other IL-7 pathway genes are highlighted. The y-axis is the log (base2) fold change of Mettl3 KO over WT, and the x-axis plots the p-value of the fold change value. b, Calculated translation efficiency for all genes, and the IL-7 & TCR pathway genes do not show difference in translation efficiency between Mettl3 KO and WT naïve T cells. c, Overall levels of RNA m6A methylation in Naïve T cells from Mettl3 KO and WT mice. c–d, Example ribosome profiles of Socs1 and Socs3 mRNAs, which do not show any significant differences between WT (right panel) and Mettl3 KO (left panel) samples. The RNA-Seq for the inputs are shown below the ribosome profiles, which also demonstrate enhanced mRNA expression for Socs genes.
Extended Data Figure 7
Extended Data Figure 7. Socs genes are signal inducible degradation-controlled genes
a, Up-regulated genes in Mettl3 KO Naïve T cells are significantly enriched in the degradation-controlled group of genes from LPS stimulated dendritic cells. We compared the genes differentially regulated by m6A in naïve T cells to degradation controlled genes in dendritic cells. We can assign cluster information to 5784 genes in our sequencing dataset. Looking at the clusters where fast degradation plays a key role (cluster 2, 4 and 6), and asking if the number of genes unregulated is significant, with a chi square test. The p value is < 0.0001. fast deg --- genes in clusters 2,5,6; not fast deg --- all other clusters; Up --- genes unregulated (marked as significant and positive fold change); Not up --- genes that don’t change or are down-regulated. b, Socs1, Socs3, and Cish, but not Socs2 degrade faster upon IL-7 treatment in WT cells, and the faster degradation with IL-7 stimulation is abrogated in Mettl3 KO naïve T cells. The Naïve T cells isolated from both WT or Mettl3 KO mice were pre-treated with Actinomycin-D for 1hr to fully stop transcription before IL-7 stimulation, the residual mRNAs at different time points were normalized back to t=0 (100%).
Extended Data Figure 8
Extended Data Figure 8. Summary of s4U-Seq data
a, Analysis of reads mapping to introns demonstrates high intronic read density in s4U-enriched samples. The ratio of reads mapping to introns is expressed as a ratio to the total number of reads that map to each transcript in each sample. b, Plot illustrating the spearman correlations of the transcript-level read frequencies in total and s4U-enriched samples for WT and Mettl3 KO cells at various times after IL-7 stimulation. c, Changes in transcript frequencies after IL-7 stimulation for WT or Mettl3 KO cells with and without s4U enrichment based on s4U-Seq data. Expression levels are presented relative to the transcript levels of WT cells before IL-7 stimulation. Shown are cluster-3 Socs genes and a control gene Xist.
Extended Data Figure 9
Extended Data Figure 9. Working model for m6A controlled Naïve T cell homeostasis
a, Mettl3 KO Naïve T cell molecular Mechanism: Loss of m6A lead to slower Socs mRNA degradation and increased SOCS protein levels, which blocked the IL7 pathway. b, Revised T cell differentiation model: m6A targets Socs1, Socs3 and Cish for inducible and rapid mRNA degradation upon IL-7 stimulation, allowing IL-7-JAKs signaling to activate the downstream target STAT5, to initiate the re-programming of the naïve T cells for differentiation and proliferation.
Figure 1
Figure 1. Mettl3 KO naïve T cells do not promote disease in CD45RB-High adoptive transfer colitis mouse model
a, Body weight changes after naïve T cell adoptive transfer into Rag2−/− host mice (n=10), 2-way ANOVA. b, c, Endoscopic colitis scores and representative pictures of H&E staining of the colon from Rag2−/− receiving WT and KO naive T cells 8 weeks after transfer (n=10), unpaired t test. d, FACS analysis of transferred T cells in colon tissues (n=3), unpaired t test. n=number of biological replicates. p***<0.001, p****<0.0001.
Figure 2
Figure 2. Mettl3 KO naïve T cells are locked in the naïve state and proliferate much slower than WT cells after transfer into Rag2−/− mice
a, Most of the Mettl3 KO donor cells are retained in lymph nodes (LN) and are locked in naïve states 12 weeks after transfer. b, The WT donor naïve T cells start to differentiate from the second week after transfer (CD45RBlow), while the Mettl3 KO donor naïve T cells always stay in naïve states (CD45RBhigh). c, d, The WT donor naïve T cells are driven to proliferate rapidly from the 2nd week, while the Mettl3 KO T cells slowly proliferate, with the total number of cells recovered from pLN shown in (d). e, Mettl14 KO donor naïve T cells recapitulate the phenotype of Mettl3 KO donor cells. At least 6 animals in each group were analyzed, and representative images were shown.
Figure 3
Figure 3. Overexpressed m6A target genes Socs1, Socs3 and Cish in Mettl3 KO naïve T cells suppress IL-7/STAT5 signaling pathway
a, Phosphorylation of STAT5 and JAK1 is diminished upon IL-7 stimulation in vitro, and basal levels of ERK and AKT phosphorylation are enhanced in KO naïve T cells. b, Socs1, Socs3 and Cish are among the most significant up-regulated genes in Mettl3 KO over WT naïve T cells from RNA-Seq. c, d, RT-qPCR and Western Blots validate that Socs1, Socs3 and Cish mRNA are over-expressed in Mettl3 KO versus WT naïve T cells, unpaired t test. e, Socs1 siRNA knockdown in Mettl3 KO naïve T cells partially rescues the differentiation defects 4 weeks after transfer into Rag2−/− mice. f, m6A peaks are enriched in 3′-UTR of Scos1 and Socs3 genes from m6A RIP-Seq data with WT CD4+ T cells. g, Socs1, Socs3 and Cish are m6A modified, and the marker is lost in Mettl3 KO naïve T cells., 2-way ANOVA. h, RNA degradation assay shows Socs1, Socs3 and Cish mRNAs degrade slower in Mettl3 KO naïve T cells than that in WT cells two hours after Actinomycin-D treatment. The residual RNA were normalized to t=0. Three independent experiments were done for all the blots and qPCR assays. **p<0.01. ***p<0.001. ****<0.0001.
Figure 4
Figure 4. m6A specifically target a group of immediate-early genes for degradation upon IL-7 stimulation
a, s4U-Seq experiment overview. b, Heatmap showing the results of clustering that normalizes transcript expression levels with significant changes after IL-7 induction and differences between WT and Mettl3−/−. Cluster 3 contains 34 transcripts with similar expression profiles including Cish, Socs3 and Socs1. c, Computed RNA degradation rates from s4U-Seq data. d, Read density for total RNA and s4U-enriched RNA at the indicated genes for WT and Mettl3−/− samples after IL-7 stimulation.

Comment in

Similar articles

Cited by

References

    1. Cao G, Li HB, Yin Z, Flavell RA. Recent advances in dynamic m6A RNA modification. Open Biol. 2016;6:160003. doi: 10.1098/rsob.160003. - DOI - PMC - PubMed
    1. Fu Y, Dominissini D, Rechavi G, He C. Gene expression regulation mediated through reversible m(6)A RNA methylation. Nature reviews. Genetics. 2014;15:293–306. doi: 10.1038/nrg3724. - DOI - PubMed
    1. Geula S, et al. Stem cells. m6A mRNA methylation facilitates resolution of naive pluripotency toward differentiation. Science. 2015;347:1002–1006. doi: 10.1126/science.1261417. - DOI - PubMed
    1. Batista PJ, et al. m(6)A RNA Modification Controls Cell Fate Transition in Mammalian Embryonic Stem Cells. Cell stem cell. 2014;15:707–719. doi: 10.1016/j.stem.2014.09.019. - DOI - PMC - PubMed
    1. Collins A, Littman DR. Selection and lineage specification in the thymus: commitment 4-stalled. Immunity. 2005;23:4–5. doi: 10.1016/j.immuni.2005.07.003. - DOI - PubMed

Publication types

MeSH terms