. 2017 Aug 8;113(3):605-612.
doi: 10.1016/j.bpj.2017.06.041.

Ketamine Inhibition of the Pentameric Ligand-Gated Ion Channel GLIC

Affiliations

Ketamine Inhibition of the Pentameric Ligand-Gated Ion Channel GLIC

Bogdan F Ion et al. Biophys J. .

Abstract

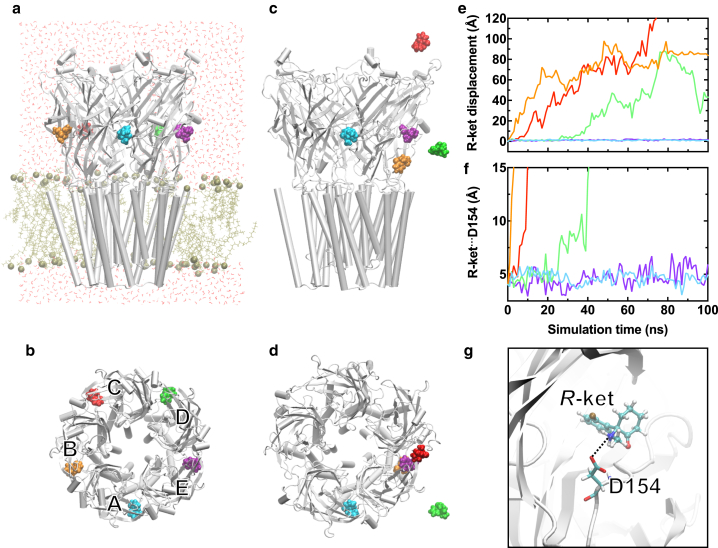
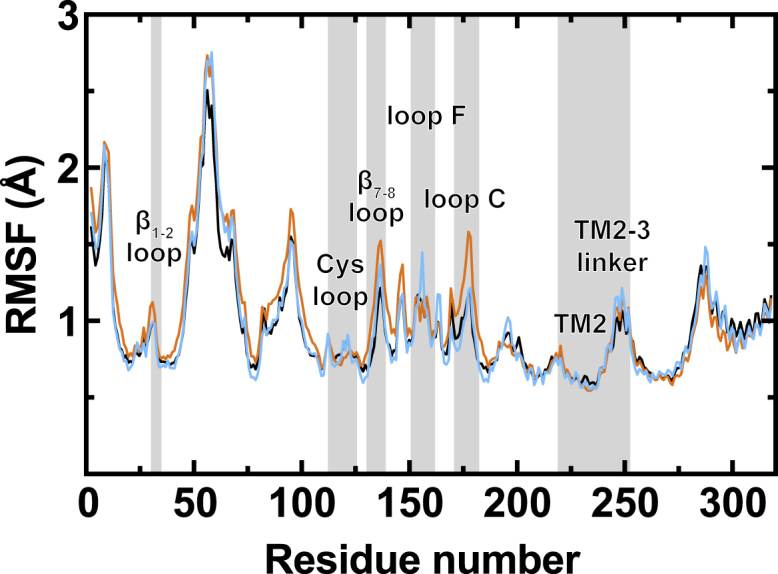
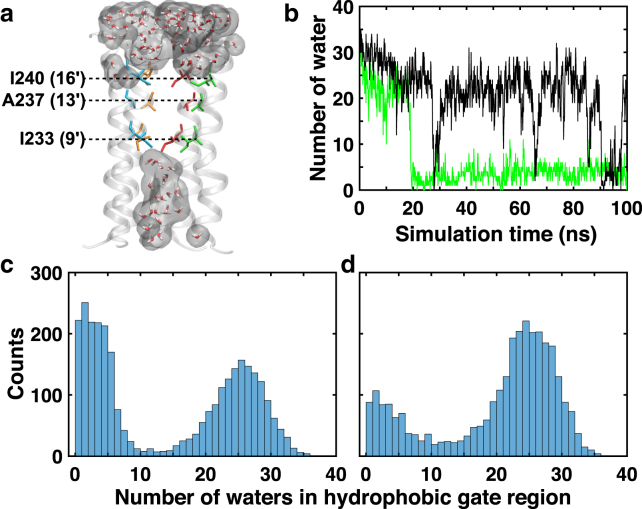
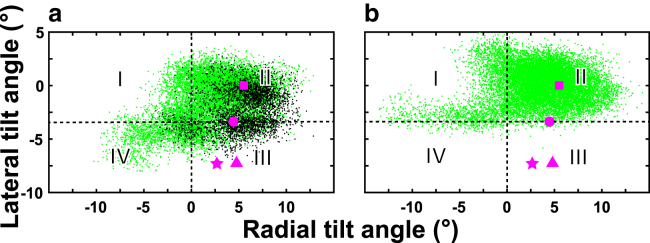
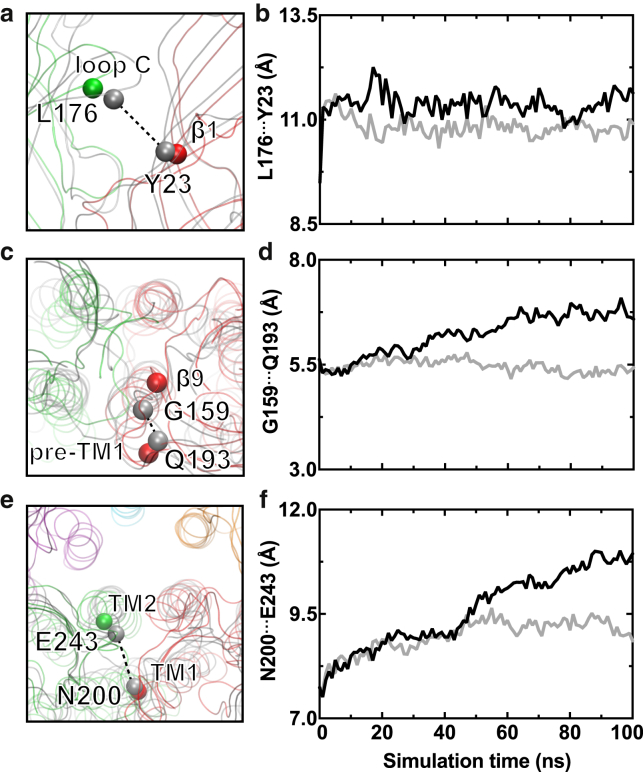
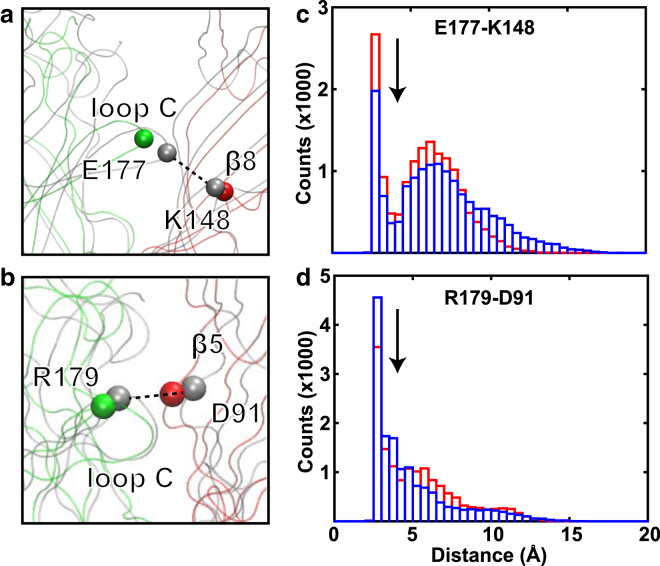
Ketamine inhibits pentameric ligand-gated ion channels (pLGICs), including the bacterial pLGIC from Gloeobacter violaceus (GLIC). The crystal structure of GLIC shows R-ketamine bound to an extracellular intersubunit cavity. Here, we performed molecular dynamics simulations of GLIC in the absence and presence of R- or S-ketamine. No stable binding of S-ketamine in the original cavity was observed in the simulations, largely due to its unfavorable access to residue D154, which provides important electrostatic interactions to stabilize R-ketamine binding. Contrary to the symmetric binding shown in the crystal structure, R-ketamine moved away from some of the binding sites and was bound to GLIC asymmetrically at the end of simulations. The asymmetric binding is consistent with the experimentally measured negative cooperativity of ketamine binding to GLIC. In the presence of R-ketamine, all subunits showed changes in structure and dynamics, irrespective of binding stability; the extracellular intersubunit cavity expanded and intersubunit electrostatic interactions involved in channel activation were altered. R-ketamine binding promoted a conformational shift toward closed GLIC. Conformational changes near the ketamine-binding site were propagated to the interface between the extracellular and transmembrane domains, and further to the pore-lining TM2 through two pathways: pre-TM1 and the β1-β2 loop. Both signaling pathways have been predicted previously using the perturbation-based Markovian transmission model. The study provides a structural and dynamics basis for the inhibitory modulation of ketamine on pLGICs.


Figures

Figure 1
Figure 1
R-ket binding to GLIC. (a) Given here are side and (b) top views of R-ket binding sites in the crystal structure of GLIC (PDB: 4F8H) at the beginning of MD simulations. POPE/POPG lipids and water molecules in (a) are colored in tan and red, respectively. (c and d) Given here are side and top views of R-ket binding after 100 ns of MD simulation, showing that two R-ket molecules (cyan and purple) remained in the original binding sites. (e) Shown here are displacements of R-ket, measured by the center of mass, over the course of MD simulations. (f) Distances between R-ket amine nitrogen and D154 side-chain carbonyl oxygen over the course of MD simulations are given. Note that R-ket molecules (cyan and purple) within the salt-bridge distance with D154 are the same R-ket showing stable binding in (ce). (g) Given here is a representative snapshot showing electrostatic interactions between R-ket and D154 of GLIC. To see this figure in color, go online.
Figure 2
Figure 2
R-ket effects on the RMSFs of GLIC. Average Cα RMSF over the course of the last 50 ns of the simulations, from three replicates for each system, was calculated for the apo system (black) and R-ket system that contains GLIC subunits with stable (cyan, four subunits) and unstable (orange, 11 subunits) R-ket binding. To see this figure in color, go online.
Figure 3
Figure 3
R-ket effects on hydration of the hydrophobic gate region. (a) A representative snapshot of dehydration in the hydrophobic gate region between residues I240 to I233 is given. For clarity, only four TM2 helices are shown. (b) Given here are the representative water counts in the hydrophobic gate region for the apo (black) and R-ket bound (green) systems. (c and d) Shown here are histograms of water counts in the hydrophobic gate region for (c) R-ket bound and (d) apo GLIC systems. Each system has 3000 structures from three replicates used for histogram calculations. To see this figure in color, go online.
Figure 4
Figure 4
Distribution of radial and lateral tilting angles of TM2 helices from three replicate simulations (a) in the presence of R-ket or (b) apo GLIC. Black dots in (a) highlight TM2 tilt angles in subunits with stable R-ket binding. The TM2 tilting angles in crystal structures are marked for reference: magenta squares for the open-channel (PDB: 3EAM (23)), circles for the locally closed (PDB: 4NPP (50)), and triangles and stars for the two closed channels (PDB: 4LMK (52) and 4NPQ (50)), respectively. Four quadrants are defined by lateral and radial tilt angles of −3.4 and 0.0°, respectively. Quadrant II contains open conformations of GLIC. To see this figure in color, go online.
Figure 5
Figure 5
Conformational changes from the R-ket binding site in the ECD to the channel gate. Given here is a comparison of residue-pair Cα distances between (a and b) L176 and Y23 of the adjacent subunit, (c and d) G159 and Q193, and (e and f) E243 and N200 of the adjacent subunit in the R-ket and apo systems. Snapshots showing Cα distances at the end of apo (gray) and R-ket bound (green or red) simulations are shown in (a), (c), and (e). Average distances over all subunits in three replicate 100-ns simulations for apo (gray) and R-ket bound (black) systems are shown in (b), (d), and (f). To see this figure in color, go online.
Figure 6
Figure 6
R-ket effects on extracellular intersubunit interfaces. Given here are snapshots showing Cα distances between (a) E177 and K148 of the adjacent subunit and (b) R179 and D91 of the adjacent subunit at the end of apo (gray) and R-ket (green or red) simulations. Given also are histograms of distances (c) between E177 side-chain carbonyl oxygen and K148 side-chain nitrogen and (d) between R179 side-chain nitrogen and D91 side-chain carbonyl oxygen over three replicate simulations for R-ket bound (blue) and apo (red) systems. A bin size of 0.5 Å was used. Arrows indicate the 4 Å distance upper limit for stable salt-bridge formation. To see this figure in color, go online.

References

    1. Mashour G.A. Network-level mechanisms of ketamine anesthesia. Anesthesiology. 2016;125:830–831. - PMC - PubMed
    1. Paul R.K., Singh N.S., Wainer I.W. (R,S)-Ketamine metabolites (R,S)-norketamine and (2S,6S)-hydroxynorketamine increase the mammalian target of rapamycin function. Anesthesiology. 2014;121:149–159. - PMC - PubMed
    1. Zanos P., Moaddel R., Gould T.D. NMDAR inhibition-independent antidepressant actions of ketamine metabolites. Nature. 2016;533:481–486. - PMC - PubMed
    1. Erstad B.L., Patanwala A.E. Ketamine for analgosedation in critically ill patients. J. Crit. Care. 2016;35:145–149. - PubMed
    1. Persson J. Ketamine in pain management. CNS Neurosci. Ther. 2013;19:396–402. - PMC - PubMed

MeSH terms