. 2017 Aug 8;20(6):1463-1475.
doi: 10.1016/j.celrep.2017.07.029.

Characterizing Expression and Processing of Precursor and Mature Human tRNAs by Hydro-tRNAseq and PAR-CLIP

Affiliations

Characterizing Expression and Processing of Precursor and Mature Human tRNAs by Hydro-tRNAseq and PAR-CLIP

Tasos Gogakos et al. Cell Rep. .

Abstract

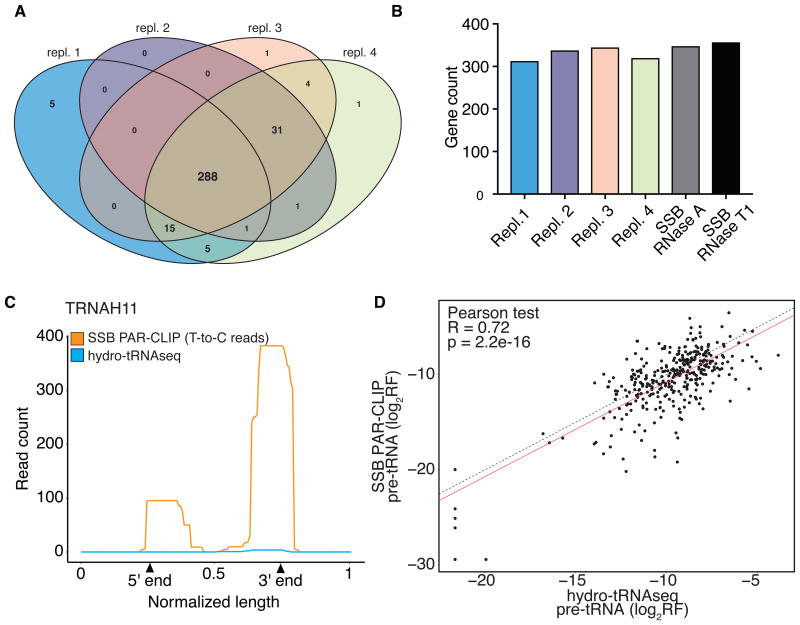
The participation of tRNAs in fundamental aspects of biology and disease necessitates an accurate, experimentally confirmed annotation of tRNA genes and curation of tRNA sequences. This has been challenging because RNA secondary structure, nucleotide modifications, and tRNA gene multiplicity complicate sequencing and mapping efforts. To address these issues, we developed hydro-tRNAseq, a method based on partial alkaline RNA hydrolysis that generates fragments amenable for sequencing. To identify transcribed tRNA genes, we further complemented this approach with photoactivatable crosslinking and immunoprecipitation (PAR-CLIP) of SSB/La, a conserved protein involved in pre-tRNA processing. Our results show that approximately half of all predicted tRNA genes are transcribed in human cells. We also report nucleotide modification sites and their order of introduction, and we identify tRNA leaders, trailers, and introns. By using complementary sequencing-based methodologies, we present a human tRNA atlas and determine expression levels of mature and processing intermediates of tRNAs in human cells.


Figures

Figure 1
Figure 1. Experimental and bioinformatic pipeline for tRNA annotation and reference transcript curation by hydro-tRNAseq
(A) tRNAs and pre-tRNAs were size-selected from HEK293 total RNA and subjected to limited alkaline hydrolysis, followed by dephosphorylation, rephosphorylation and conventional small RNA sequencing as described previously (Hafner et al., 2012b). (B) An iterative mapping and annotation protocol was used to first annotate and curate fully processed and nucleotide-modified mature tRNAs. Leftover reads that spanned the mature-precursor junctions were used to identify transcribed tRNA genes. See also Fig. S1, S2, S8 and Tables S1 and S2.
Figure 2
Figure 2. SSB PAR-CLIP
(A) Total RNA composition of the 60-100 nt size fraction from hydro-tRNAseq according to RNA classes; data from deepest and richest in tRNA library (replicate 1) shown. (B) Phosphorimage of SSB-crosslinked to radiolabeled RNA. PAR-CLIP was performed using RNase A or RNase T1, at two different concentrations to account for possible biases of RNase treatment conditions. Libraries from PAR-CLIP using 1 U/μL of RNase A and RNase T1 were prepared and submitted for sequencing. Western blot against HA, shown in the bottom, confirmed the immunoprecipitation of SSB. (C) Assignment of reads from SSB PAR-CLIP (RNase T1, 1 U/μL) to RNA classes. (D) SSB PAR-CLIP reads mapping to tRNA precursors with 0, 1 or 2 mismatches (d0, d1, d2); reads with T-to-C mismatches are separated (red) from the rest of the reads with one mismatch (gray). Read length and number of reads are represented on the x- and y-axis, respectively. (E) Positional preference of SSB crosslinking by metagene analysis of all crosslinking events to precursor tRNAs. The incidence of T-to-C transitions is indicated by color intensity. (F) Positional preference of SSB crosslinking by metagene analysis of reads mapped hierarchically; first to mature and then to precursor tRNAs. For each class, PAR-CLIP signal (reads containing T-to-C) and background (reads with no mismatches) are shown. The normalized boundaries of pre-tRNAs (labeled as 0,1) and mature tRNAs (labeled as 5′ end, 3′ end), and read count are shown on the x- and y-axis, respectively. See also Fig. S3, and Tables S1 and S3.
Figure 3
Figure 3. tRNA gene annotation
(A) Venn diagram of expressed tRNA genes detected by hydro-tRNAseq in HEK293 cells. Genes with read evidence in both the 5′ leader and 3′ trailer of the pre-tRNA were counted. (B) Bar chart showing the number of pre-tRNAs detected in each replicate of hydro-tRNAseq and SSB PAR-CLIP. (C) Example of one out of seven pre-tRNAs that were detected by SSB PAR-CLIP, but were not detected in any of four hydro-tRNAseq replicates. (D) Correlation of relative read frequencies (log2-transformed) of precursor tRNAs between hydro-tRNAseq (x-axis) and SSB PAR-CLIP (y-axis). Correlation was calculated using the Pearson test. Linear fit is shown in red. The y=x line (dotted) is shown for comparison. See also Fig. S4, S5 and S6, and Table S2, S3 and S4.
Figure 4
Figure 4. Number and relative abundance of tRNA genes per isotype and isoacceptor
(A) Correlation of relative read frequency (y-axis) of mature tRNAs with number of genes (x-axis) per tRNA isotype. Hydro-tRNAseq data; four replicates; mean values shown; error bars represent standard deviation. (B) Number of tRNA genes for each anticodon and isotype. Hydro-tRNAseq data are shown in black (mean of 4 replicates; error bars represent standard deviation), SSB PAR-CLIP (RNase T1 treated) in red. (C) Correlation of gene counts for each anticodon detected by hydro-tRNAseq (y-axis) and SSB PAR-CLIP (x-axis). Each dot represents an anticodon shown in (B). Correlation was calculated using the Pearson test. (D) Average gene count and relative frequency for each anticodon. The gene count (mean of 4 replicates) is shown on the y-axis, anticodons on the x-axis; isotypes are indicated on the top. The area of each black disc is proportional to the fraction of reads mapping to all mature tRNAs for a given anticodon, normalized over all mature tRNAs for all anticodons. See also Fig. S5, S8, and Table S5.
Figure 5
Figure 5. Annotation of intron-containing tRNA genes
(A) Number of validated intron-containing (orange) and intronless (blue) tRNA genes for all tRNA isotypes with possible intron-containing tRNAs. (B), (C) Analysis of PAR-CLIP for the tRNA ligase, RTCB (previously published in (Baltz et al., 2012)). Positional preference of crosslinking by metagene analysis of all crosslinking events (B) and all crosslinked reads (C) to mature tRNAs. The incidence of T-to-C transitions is indicated by color intensity in (B). PAR-CLIP signal (reads containing T-to-C), background (reads with no mismatches), normalized boundaries of the pre-tRNAs (labeled as 0, 1) and mature tRNAs (labeled as 5′ end, 3′ end) are shown in (C). See also Table S2.
Figure 6
Figure 6. Boundaries of tRNA transcription initiation and termination
(A-C) Histogram of the length distribution of precursor tRNA 5′ leaders (A) and 3′ trailers (B) detected by hydro-tRNAseq, and trailers detected by SSB PAR-CLIP (C). (D,E) Histogram of the length distribution for the longest oligoU tract per precursor tRNA 3′ trailer detected by hydro-tRNAseq (D) (aggregate gene total of all replicates shown on the y-axis), and by SSB PAR-CLIP (E). Mean of 4 hydro-tRNAseq replicates ± SD. RNase T1-treated replicate is shown for SSB PAR-CLIP. See also Fig. S7.
Figure 7
Figure 7. tRNA modifications
(A) The positions that resulted in the most common mismatches over all tRNAs, along with the reference nucleotide and the most likely modification are indicated in the center of each ring. The relative frequency of each returned nucleoside is proportional to the corresponding color-coded area of the ring (m1G: 1-methylguanosine; m2,2G: N2,N2-dimethylguanosine; I: inosine; m1I: 1-methylinosine; m7G: 7-methylguanosine; m1A: 1-methyladenosine). (B) Read alignments for precursor TRNAA6 with one (top) and two mismatches (bottom). The position of the anticodon is marked by the black rectangle at the top of the alignments. Mismatches of the heavily modified adenosines in the anticodon loop are indicated by red lowercase letters. Read counts and mapping locations for each read are shown on the right side. Vertical bars represent binned, log4-transformed, and normalized read counts for each alignment. See also Table S6.

References

    1. Arimbasseri AG, Maraia RJ. Distinguishing Core and Holoenzyme Mechanisms of Transcription Termination by RNA Polymerase III. Molecular and Cellular Biology. 2013;33:1571–1581. - PMC - PubMed
    1. Arimbasseri AG, Maraia RJ. Mechanism of Transcription Termination by RNA Polymerase III Utilizes a Non-template Strand Sequence-Specific Signal Element. Molecular Cell. 2015;58:1124–1132. - PMC - PubMed
    1. Arimbasseri AG, Blewett NH, Iben JR, Lamichhane TN, Cherkasova V, Hafner M, Maraia RJ. RNA Polymerase III Output Is Functionally Linked to tRNA Dimethyl-G26 Modification. PLoS Genet. 2015;11:e1005671–22. - PMC - PubMed
    1. Arimbasseri AG, Iben J, Wei FY, Rijal K, Tomizawa K, Hafner M, Maraia RJ. Evolving specificity of tRNA 3-methyl-cytidine-32 (m 3C32) modification: a subset of tRNAs Serrequires N6-isopentenylation of A37. Rna. 2016;22:1400–1410. - PMC - PubMed
    1. Arimbasseri AG, Kassavetis GA, Maraia RJ. Transcription. Comment on “Mechanism of eukaryotic RNA polymerase III transcription termination”. Science. 2014;345:524–524. - PMC - PubMed

Publication types