. 2015 Sep 14;8(9):6117-6153.
doi: 10.3390/ma8095295.

Pyrolysis Model Development for a Multilayer Floor Covering

Affiliations

Pyrolysis Model Development for a Multilayer Floor Covering

Mark B McKinnon et al. Materials (Basel). .

Erratum in

Abstract

Comprehensive pyrolysis models that are integral to computational fire codes have improved significantly over the past decade as the demand for improved predictive capabilities has increased. High fidelity pyrolysis models may improve the design of engineered materials for better fire response, the design of the built environment, and may be used in forensic investigations of fire events. A major limitation to widespread use of comprehensive pyrolysis models is the large number of parameters required to fully define a material and the lack of effective methodologies for measurement of these parameters, especially for complex materials. The work presented here details a methodology used to characterize the pyrolysis of a low-pile carpet tile, an engineered composite material that is common in commercial and institutional occupancies. The studied material includes three distinct layers of varying composition and physical structure. The methodology utilized a comprehensive pyrolysis model (ThermaKin) to conduct inverse analyses on data collected through several experimental techniques. Each layer of the composite was individually parameterized to identify its contribution to the overall response of the composite. The set of properties measured to define the carpet composite were validated against mass loss rate curves collected at conditions outside the range of calibration conditions to demonstrate the predictive capabilities of the model. The mean error between the predicted curve and the mean experimental mass loss rate curve was calculated as approximately 20% on average for heat fluxes ranging from 30 to 70 kW·m-2, which is within the mean experimental uncertainty.

Keywords: Controlled Atmosphere Pyrolysis Apparatus; ThermaKin; carpet; composites; engineered materials; fire modeling; gasification; material flammability.


Conflict of interest statement

The authors declare no conflict of interest.

Figures

Figure 1
Figure 1
Schematic of the EcoWorx carpet tile [19].
Figure 2
Figure 2
Photographs of (a) full carpet composite; (b) upper layer; and (c) base layer.
Figure 3
Figure 3
Rendering of the method used to measure absorption coefficient.
Figure 4
Figure 4
Rendering of the Controlled Atmosphere Pyrolysis Apparatus (CAPA).
Figure 5
Figure 5
Photograph of a carpet composite sample mounted on the sample holder for CAPA tests.
Figure 6
Figure 6
Experimentally observed and modeled heating rate histories typical of the Simultaneous Thermal Analysis (STA). The coefficients for Equation (11) that describe the modeled curve are the following: a = 0.166 K s−1, b = 0.0024 s−1, f = 0.004 s−1, g = −0.0623.
Figure 7
Figure 7
Normalized mass loss rate (MLR) and normalized mass data collected in STA experiments and model predicted curves for: (a) and (b) face yarn layer; (c) and (d) the middle layer; and (e) and (f) the base layer. Error bars indicate two standard deviations of the mean experimental data.
Figure 8
Figure 8
Normalized heat flow rate and integral heat flow rate data collected in STA experiments and model predicted curves for: (a) and (b) face yarn layer; (c) and (d) the middle layer; and (e) and (f) the base layer. Error bars indicate two standard deviations of the mean experimental data.
Figure 9
Figure 9
Experimentally observed and modeled heating rate histories typical of the Microscale Combustion Calorimetry (MCC) experiments conducted in this work. The coefficients for Equation (14) that describe the modeled curve are the following: a = 0.168 K s−1, b = 0.0039 s−1, f = 0.0065 s−1, g = 0.256.
Figure 10
Figure 10
Normalized heat release rate and integral heat release rate data collected in MCC experiments and model predicted curves for: (a) and (b) the face yarn layer; (c) and (d) the middle layer; and (e) and (f) the base layer. Error bars were omitted due to small magnitude scatter.
Figure 10
Figure 10
Normalized heat release rate and integral heat release rate data collected in MCC experiments and model predicted curves for: (a) and (b) the face yarn layer; (c) and (d) the middle layer; and (e) and (f) the base layer. Error bars were omitted due to small magnitude scatter.
Figure 11
Figure 11
First 120 s of experimental Tback curve measured in Controlled Atmosphere Pyrolysis Apparatus (CAPA) tests and corresponding model predicted curve for the upper layer exposed to a radiant flux of 30 kW·m−2. The shaded region corresponds to two standard deviations of the mean experimental data.
Figure 12
Figure 12
Final 480 s of experimental Tback curve measured in CAPA tests and corresponding model predicted curve for the upper layer exposed to a radiant flux of 30 kW·m−2. The shaded region corresponds to two standard deviations of the mean experimental data.
Figure 13
Figure 13
First 150 s of experimental Tback curve measured in CAPA tests and corresponding model predicted curve for the base layer exposed to a radiant flux of 30 kW·m−2. The shaded region corresponds to two standard deviations of the mean experimental data.
Figure 14
Figure 14
Final 450 s of experimental Tback curve measured in CAPA tests and corresponding model predicted curve for the base layer exposed to a radiant flux of 30 kW·m−2. The shaded region corresponds to two standard deviations of the mean experimental data.
Figure 15
Figure 15
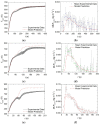
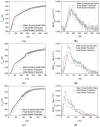
Experimental Tback and MLR curve collected in CAPA tests and corresponding model predicted curve for the upper layer exposed to radiant fluxes of (a) and (b) 30 kW·m−2; (c) and (d) 50 kW·m−2; and (e) and (f) 70 kW·m−2. The shaded region and error bars correspond to two standard deviations of the mean experimental data.
Figure 16
Figure 16
Experimental Tback and MLR curves collected in CAPA tests and corresponding model predicted curves for the base layer exposed to radiant fluxes of (a) and (b) 30 kW·m−2, (c) and (d) 50 kW·m−2, and (e) and (f) 70 kW·m−2. The shaded region and error bars correspond to two standard deviations of the mean experimental data.
Figure 17
Figure 17
Experimental Tback and MLR curve collected in CAPA tests and corresponding model predicted curves for the full carpet composite exposed to radiant fluxes of (a) and (b) 30 kW·m−2, (c) and (d) 50 kW·m−2, and (e) and (f) 70 kW·m−2. The shaded region and error bars correspond to two standard deviations of the mean experimental data.

References

    1. ASTM Standard E1354 . Test Method for Heat and Visible Smoke Release Rates for Materials and Products Using an Oxygen Consumption Calorimeter. ASTM International; West Conshohocken, PA, USA: 2015.
    1. ASTM Standard E2058 . Standard Test Methods for Measurement of Material Flammability Using a Fire Propagation Apparatus (FPA) ASTM International; West Conshohocken, PA, USA: 2013.
    1. ASTM Standard D2859 . Standard Test Method for Ignition Characteristics of Finished Textile Floor Covering. ASTM International; West Conshohocken, PA, USA: 2011.
    1. ASTM Standard E648 . Standard Test Method for Critical Radiant Flux of Floor-Covering Systems Using a Radiant Heat Energy Source. ASTM International; West Conshohocken, PA, USA: 2014.
    1. Marquis D.M., Pavageau M., Guillaume E. Multi-scale simulations of fire growth on a sandwich composite structure. J. Fire Sci. 2012;31:3–34. doi: 10.1177/0734904112453010. - DOI