Review
. 2017 Oct 6:33:103-125.
doi: 10.1146/annurev-cellbio-100616-060739. Epub 2017 Aug 9.

Excitable Signal Transduction Networks in Directed Cell Migration

Affiliations
Review

Excitable Signal Transduction Networks in Directed Cell Migration

Peter N Devreotes et al. Annu Rev Cell Dev Biol. .

Abstract

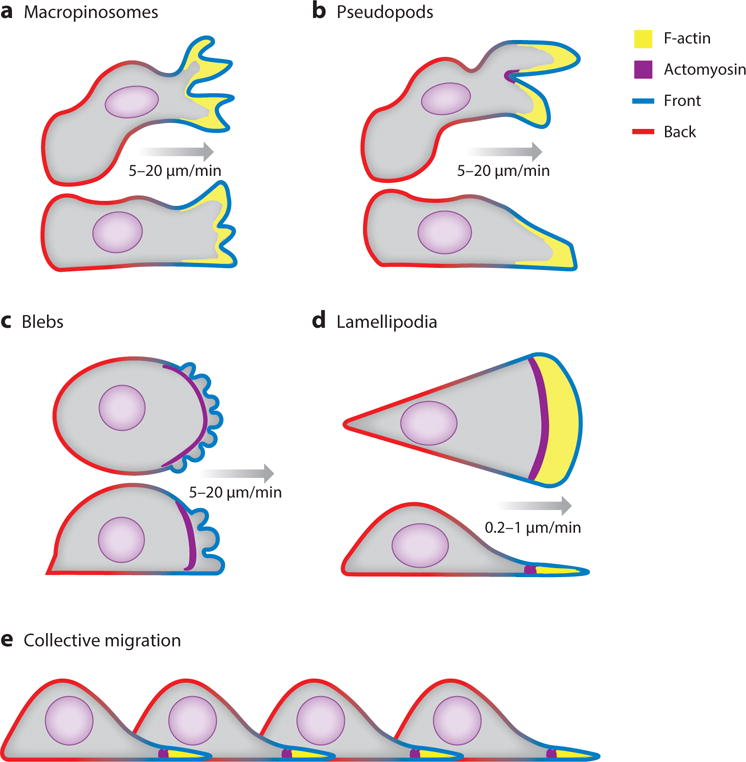
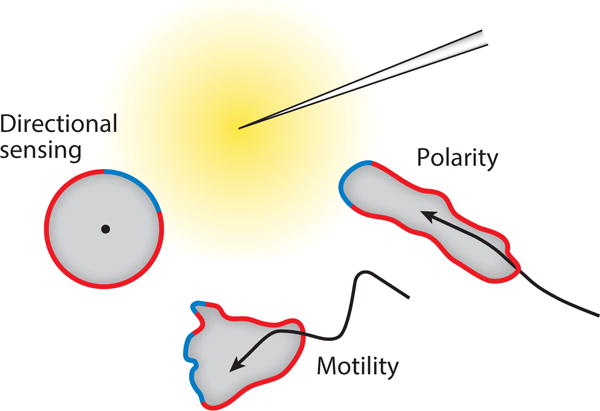
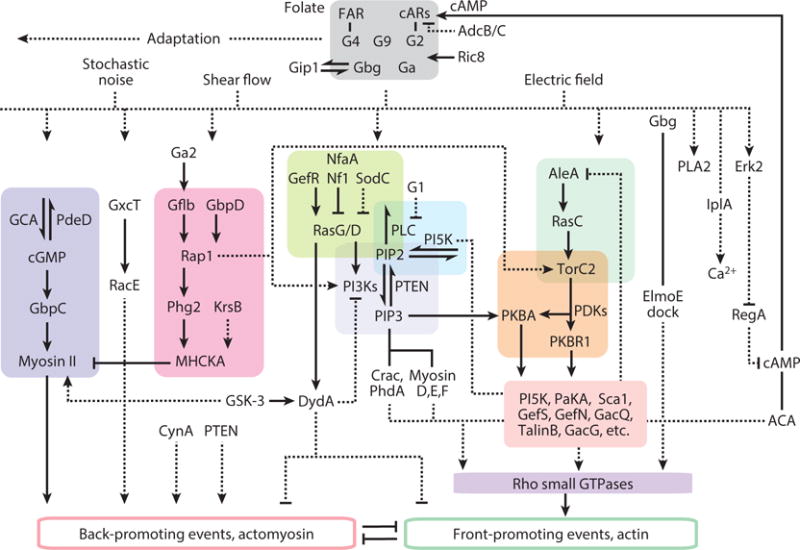
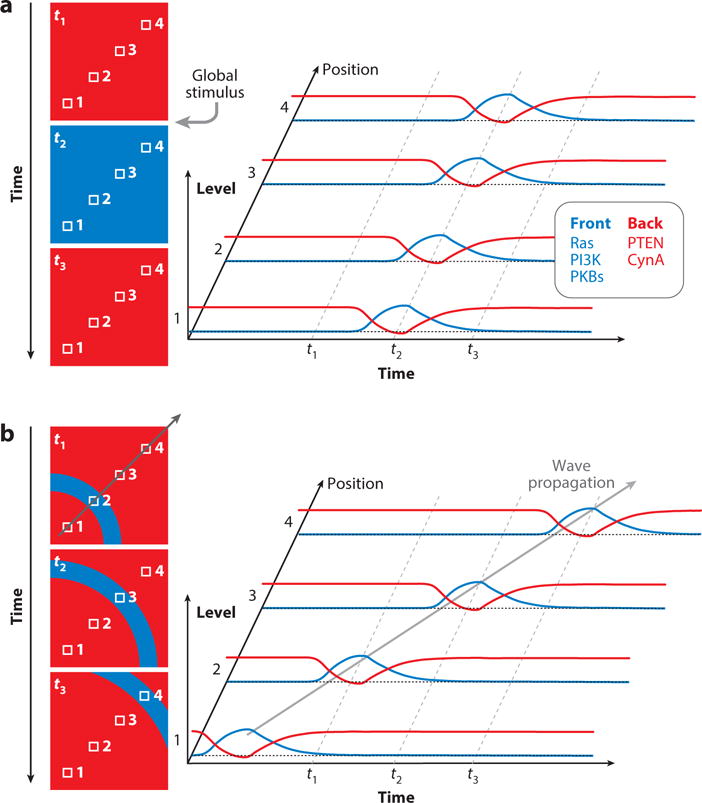
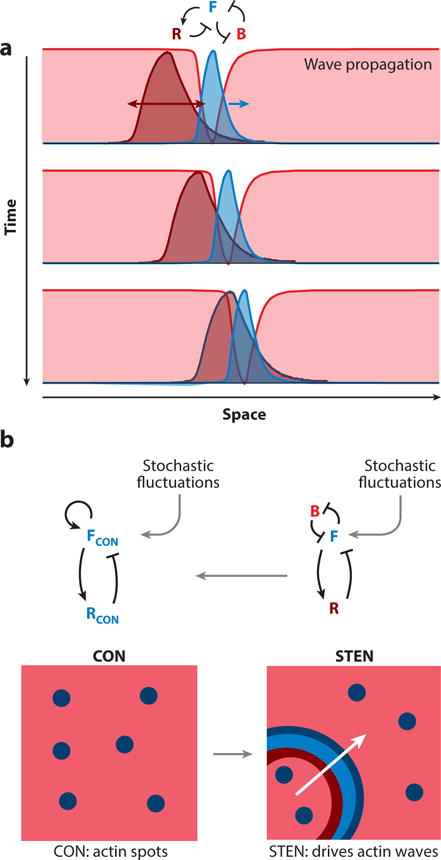
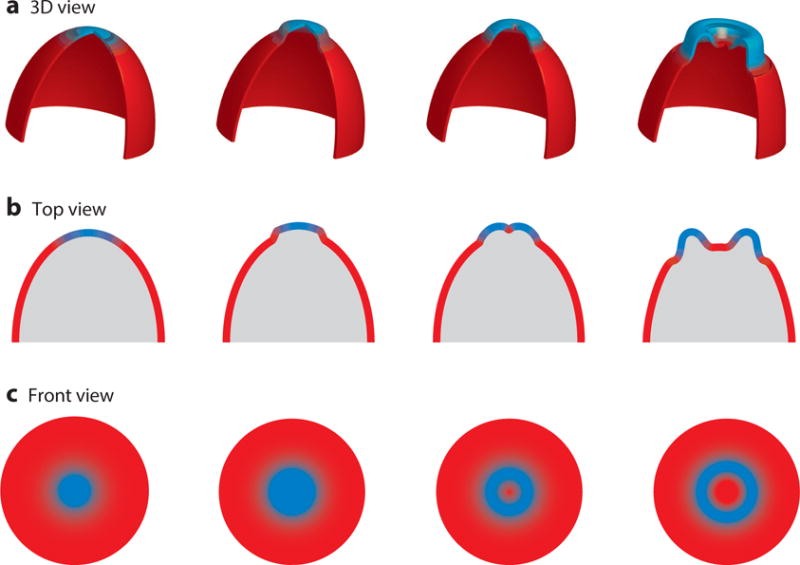
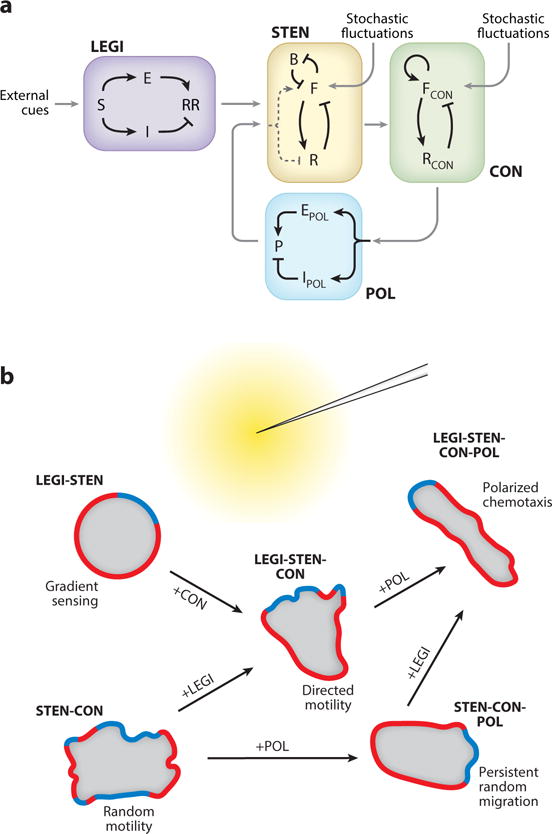
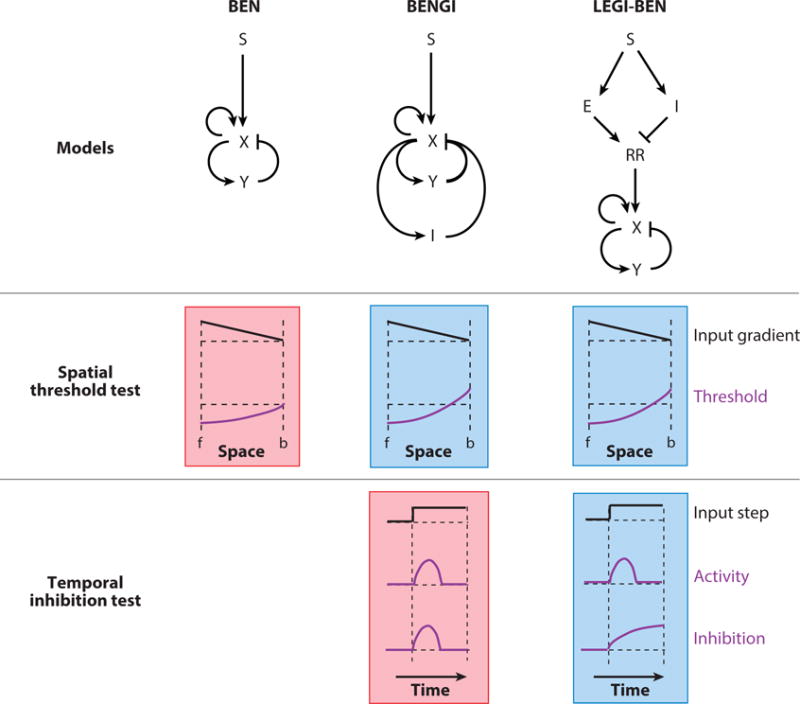
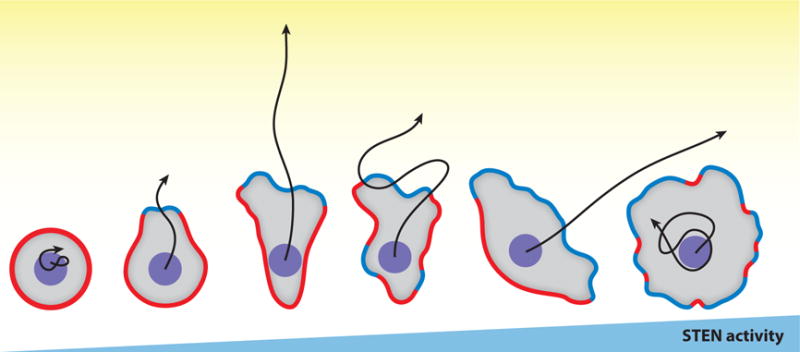
Although directed migration of eukaryotic cells may have evolved to escape nutrient depletion, it has been adopted for an extensive range of physiological events during development and in the adult organism. The subversion of these movements results in disease, such as cancer. Mechanisms of propulsion and sensing are extremely diverse, but most eukaryotic cells move by extending actin-filled protrusions termed macropinosomes, pseudopodia, or lamellipodia or by extension of blebs. In addition to motility, directed migration involves polarity and directional sensing. The hundreds of gene products involved in these processes are organized into networks of parallel and interconnected pathways. Many of these components are activated or inhibited coordinately with stimulation and on each spontaneously extended protrusion. Moreover, these networks display hallmarks of excitability, including all-or-nothing responsiveness and wave propagation. Cellular protrusions result from signal transduction waves that propagate outwardly from an origin and drive cytoskeletal activity. The range of the propagating waves and hence the size of the protrusions can be altered by lowering or raising the threshold for network activation, with larger and wider protrusions favoring gliding or oscillatory behavior over amoeboid migration. Here, we evaluate the variety of models of excitable networks controlling directed migration and outline critical tests. We also discuss the utility of this emerging view in producing cell migration and in integrating the various extrinsic cues that direct migration.

Keywords: biochemical oscillations; chemotaxis; electrotaxis; inflammation; metastasis; shear stress.


Figures

Figure 1
Figure 1
The diverse array of migratory cell projections that project the cell forward are diagrammed in coronal and sagittal slice. Green membrane represents the “front” and red represents the “back” In these cartoons, only the polymerizing F-actin and contractile actomyosin at the leading edge of cells is highlighted. A) Macropinosomes are wide cup-like shaped structures at the top and sides of the cell. B) Pseudopods are narrower protrusions usually found closer to the substrate. C) Blebs are a result of the plasma membrane detaching from the actomyosin cortex due to contractile pressure. D) Lamellipodia are sheet like structures containing distinct actin and actomyosin zones. E) Collective migration of cells connected and partially driven by cryptic lamellipodia.
Figure 2
Figure 2
The three distinct processes that coordinate to bring about directed migration towards the chemoattractant gradient (yellow). The region of the cortex facing the needle forms the “front” (green) while the quiescent “back” is demarcated by red.
Figure 3
Figure 3
Network of signal transduction pathways involved in directed cell migration in Dictyostelium. Architecture is based on biochemical and genetic analysis and reflects an extensive series of experiments by independent investigators. In most cases connections represent interpretations of phenotypes or stimulus-induced biochemical and biosensor behavior, contrasted to wild type, in cells carrying single or multiple gene deletions. Half arrows are substrate-product relationships; solid connectors represent direct interactions between components, dashed connectors are inferred or indirect links. The references supporting these interactions are included in Supplemental Table 3.
Figure 4
Figure 4
Correlation between spatial and temporal activities of front (green) and back (red) proteins. A. The colored boxes on the left represent sequential time instants. The small numbered white squares in each box denote spatial references. The plots on the right show how the global stimulus manifests as a time course at each spatial position and how the front and back proteins or biosensors (representative activities shown in the adjoining box) associate and dissociate, respectively. B. Same format as A, but showing the position of a propagating wave at three sequential times. This causes the temporal protein activities at each position to occur sequentially, in contrast to the synchronized events triggered by the global stimulus (A).
Figure 5
Figure 5
A. A cartoon of how an excitable wave propagates on the membrane. The reciprocal “front” (F) and “back” (B) zones (green and red, respectively; representative activities as in Figure 4), propagate and the “refractory” (R) zone (deep red) trails, ensuring unidirectional front propagation. B. Coupling between cytoskeletal (CON) and signaling (STEN) activities generate propagating waves of cytoskeletal activity. In the absence of STEN activity, there are flashes of actin polymerization - shown by the blue spots in the box on the left (a random 2D area on the cortex). Once STEN activity is triggered, it causes the CON spots to expand in space – driven by the excitable wave front (green) – creating actin waves.
Figure 6
Figure 6
Cartoon showing the coupling between wave propagation and topology of cellular protrusions. (Top) Three-dimensional representation of the formation of cup-like structures on the cortex as a wave propagates (green and red as “front” (F) and “back” (B) activity, respectively). (Middle and Bottom) A top and front view of these structures shows how these protrusions are born out of wave propagation as the front activity spreading outward creates a hole in 2D, which translates to a cup-like protrusion in 3D.
Figure 7
Figure 7
A representation of the various modules involved in directed cell migration. A. A schematic showing the coupling between the different proposed modules. B. How these modules coordinate to orchestrate different kinds of cell motility in the presence of a chemoattractant gradient (yellow), with green and red depicting the front (F) and back (B) activities, respectively.
Figure 8
Figure 8
A cartoon of how LEGI-BEN emerged as a realistic model of gradient sensing. Three such proposed models (structures shown on top: S, external input; X and Y, activator and inhibitor of the excitable system; I, global inhibition; E; local excitation; RR, response regulator) are put through two specific tests. The outputs shown schematically represent the responses observed. The green and red shading represent passed and failed tests respectively. For the spatial threshold test, when an input gradient is applied (f: front, b: back of cell), all three models display a lowered threshold at the front. In the BENGI and LEGI-BEN models, which have global inhibitors, the threshold is raised at the back. This would result in better directed movement. To distinguish between these two, the cells were put through a temporal inhibition test, where the global inhibitor level is quantified for a homogenous input of chemoattractant. For the BENGI model, as the inhibition follows activator level, it dies down with time. However, in the LEGI-BEN scheme, the inhibitor is derived from the input itself causing the level of inhibition to rise with time as the step is sustained, matching real cell observations.
Figure 9
Figure 9
An optimal level of STEN (signal transduction excitable network) activities is required for effective directed cell migration. Cells with increasing STEN activities are illustrated from left to right, with “green” representing front events and “red” back events. Black arrows represent centroid tracks of each cell moving towards a chemoattractant gradient (yellow) in the same amount of time.

References

    1. Allen GM, Mogilner A, Theriot JA. Electrophoresis of cellular membrane components creates the directional cue guiding keratocyte galvanotaxis. Curr Biol. 2013;23:560–568. - PMC - PubMed
    1. Anderson KI, Cross R. Contact dynamics during keratocyte motility. Curr Biol. 2000;10:253–260. - PubMed
    1. Arai Y, Shibata T, Matsuoka S, Sato MJ, Yanagida T, Ueda M. Self-organization of the phosphatidylinositol lipids signaling system for random cell migration. Proc Natl Acad Sci U S A. 2010;107:12399–12404. - PMC - PubMed
    1. Armitage JP, Hellingwerf KJ. Light-induced behavioral responses (phototaxis’) in prokaryotes. Photosynth Res. 2003;76:145–155. - PubMed
    1. Artemenko Y, Axiotakis L, Borleis J, Iglesias PA, Devreotes PN. Chemical and mechanical stimuli act on common signal transduction and cytoskeletal networks. Proc Natl Acad Sci U S A. 2016;113:E7500–E7509. - PMC - PubMed

Publication types

LinkOut - more resources