. 2017 Aug 9;18(1):595.
doi: 10.1186/s12864-017-4007-9.

Equine skeletal muscle adaptations to exercise and training: evidence of differential regulation of autophagosomal and mitochondrial components

Affiliations

Equine skeletal muscle adaptations to exercise and training: evidence of differential regulation of autophagosomal and mitochondrial components

Kenneth Bryan et al. BMC Genomics. .

Abstract

Background: A single bout of exercise induces changes in gene expression in skeletal muscle. Regular exercise results in an adaptive response involving changes in muscle architecture and biochemistry, and is an effective way to manage and prevent common human diseases such as obesity, cardiovascular disorders and type II diabetes. However, the biomolecular mechanisms underlying such responses still need to be fully elucidated. Here we performed a transcriptome-wide analysis of skeletal muscle tissue in a large cohort of untrained Thoroughbred horses (n = 51) before and after a bout of high-intensity exercise and again after an extended period of training. We hypothesized that regular high-intensity exercise training primes the transcriptome for the demands of high-intensity exercise.

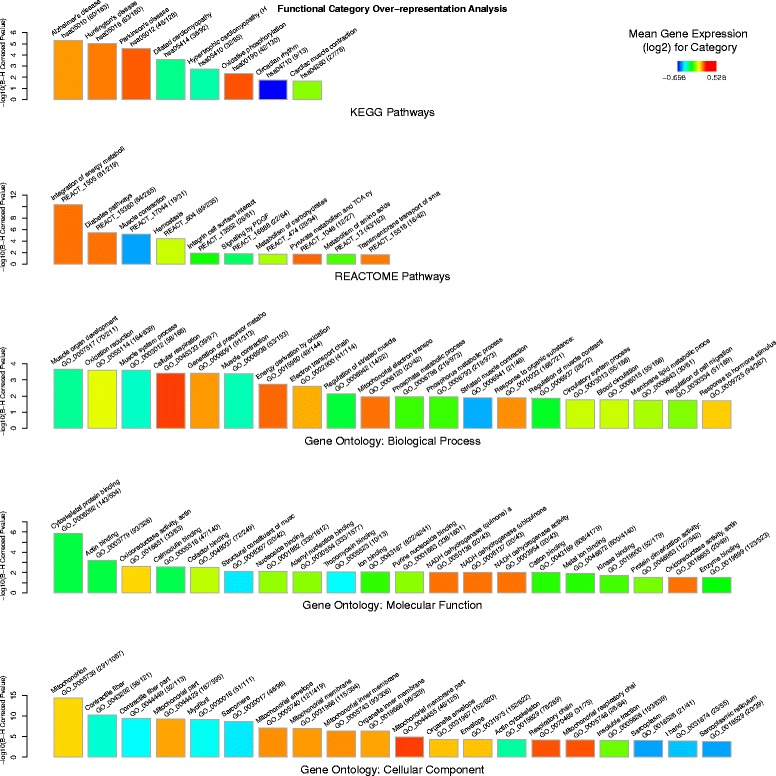
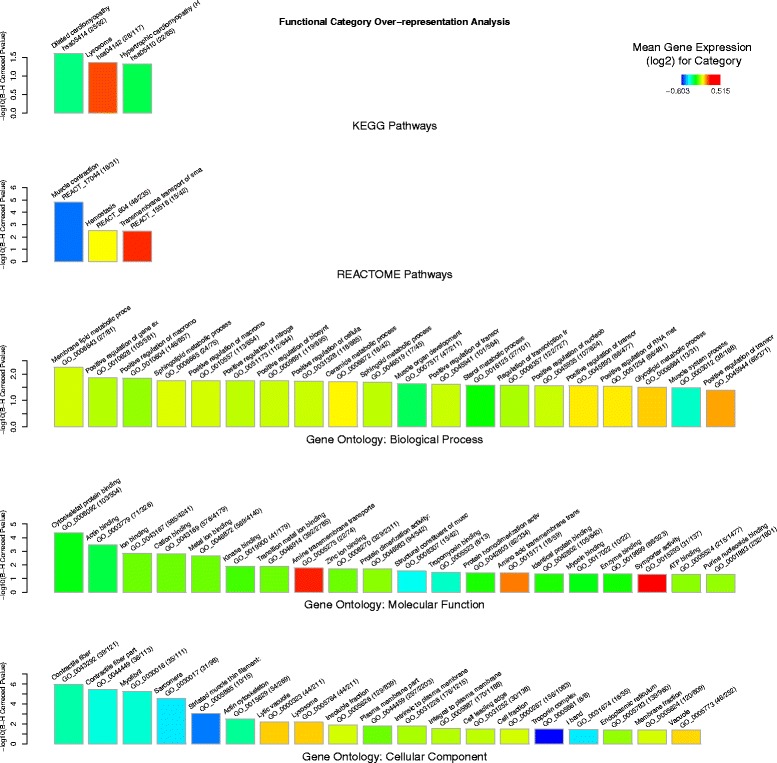
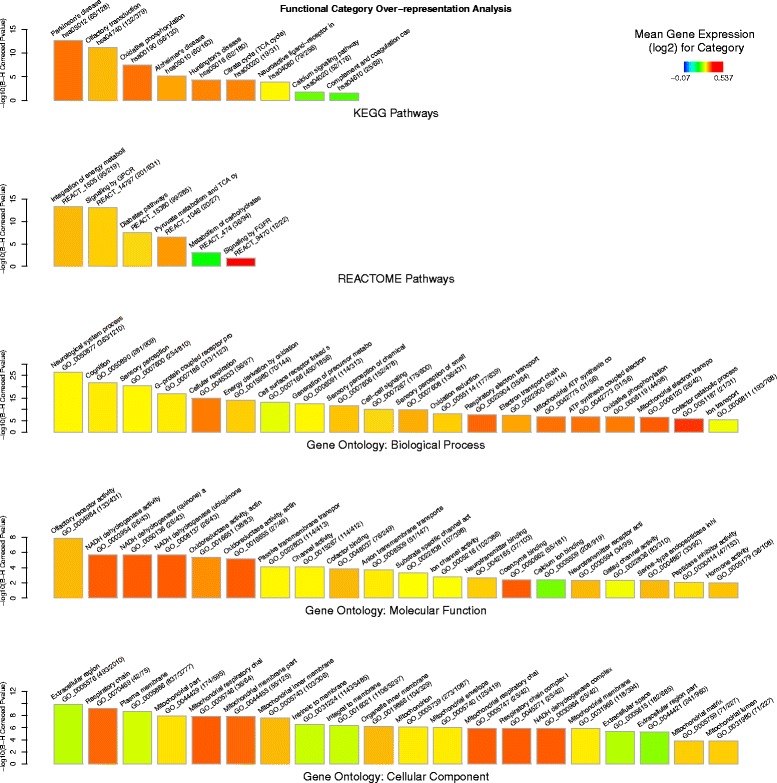
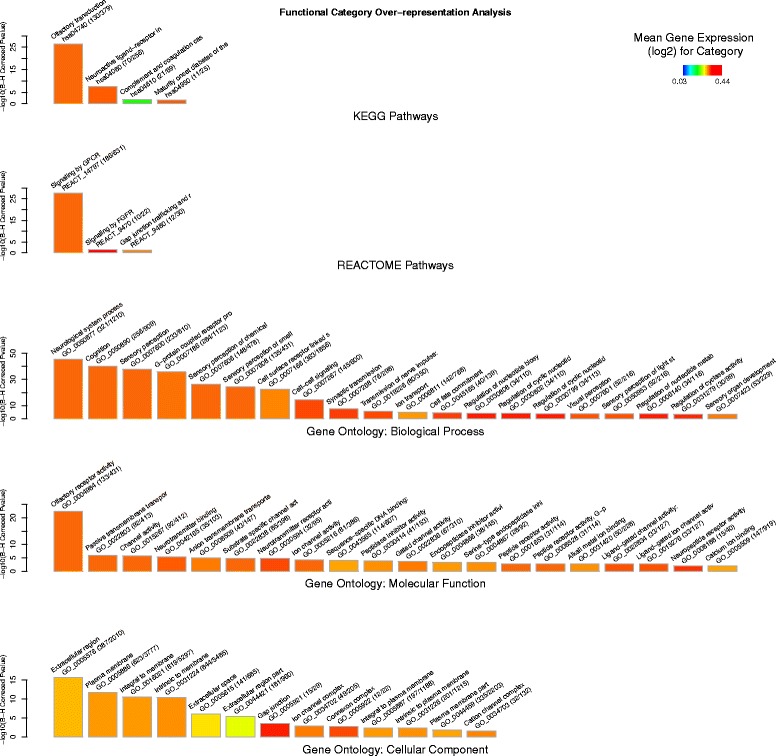
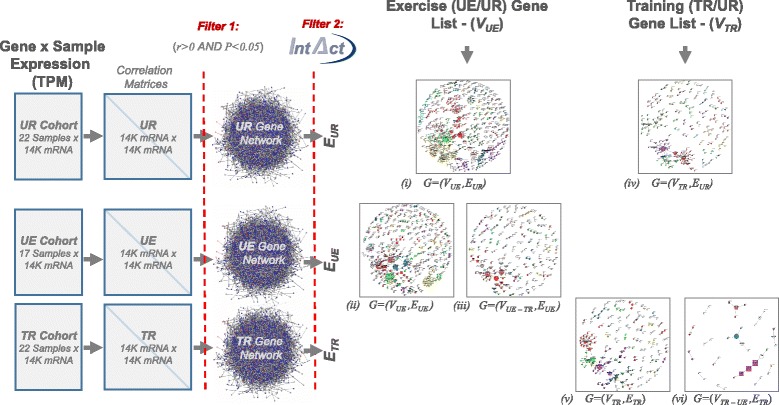
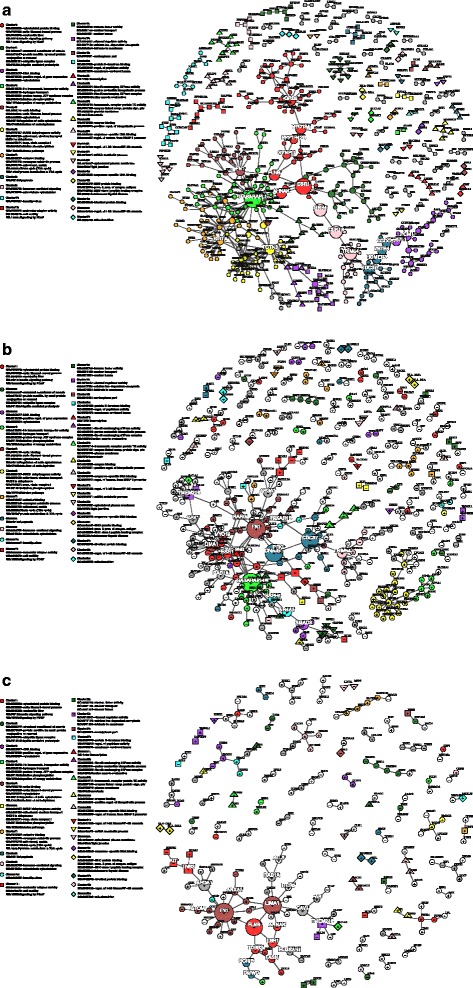
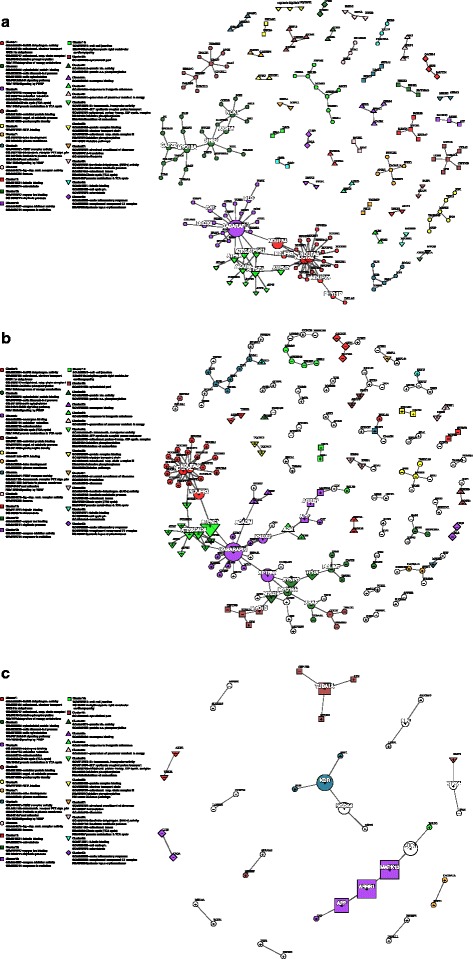
Results: An extensive set of genes was observed to be significantly differentially regulated in response to a single bout of high-intensity exercise in the untrained cohort (3241 genes) and following multiple bouts of high-intensity exercise training over a six-month period (3405 genes). Approximately one-third of these genes (1025) and several biological processes related to energy metabolism were common to both the exercise and training responses. We then developed a novel network-based computational analysis pipeline to test the hypothesis that these transcriptional changes also influence the contextual molecular interactome and its dynamics in response to exercise and training. The contextual network analysis identified several important hub genes, including the autophagosomal-related gene GABARAPL1, and dynamic functional modules, including those enriched for mitochondrial respiratory chain complexes I and V, that were differentially regulated and had their putative interactions 're-wired' in the exercise and/or training responses.

Conclusion: Here we have generated for the first time, a comprehensive set of genes that are differentially expressed in Thoroughbred skeletal muscle in response to both exercise and training. These data indicate that consecutive bouts of high-intensity exercise result in a priming of the skeletal muscle transcriptome for the demands of the next exercise bout. Furthermore, this may also lead to an extensive 're-wiring' of the molecular interactome in both exercise and training and include key genes and functional modules related to autophagy and the mitochondrion.

Keywords: Autophagy; Equine; Exercise; Functional module; Mitochondria; Network analysis; RNAseq; Skeletal muscle; Training; Transcriptome.


Conflict of interest statement

Consent for publication

All authors read and approved the final manuscript

Competing interests

None of the authors has any financial or personal relationships that could inappropriately influence or bias the content of the paper. EWH and DEM are shareholders in Plusvital Ltd., an equine nutrition and genetic testing company. Plusvital Ltd. has been granted a license for commercial use of data contained within patent applications: United States Provisional Serial Number 61/136553 and Irish patent application number 2008/0735, Patent Cooperation Treaty filing: A method for predicting athletic performance potential, September 7, 2009. EWH, DEM and LMK are named on the applications. The patent contents are not related to this manuscript. Plusvital Ltd. had no part in the research in the manuscript.

Publisher’s Note

Springer Nature remains neutral with regard to jurisdictional claims in published maps and institutional affiliations.

Figures

Fig. 1
Fig. 1
Cellular functions of the exercise response. Bar charts showing over-representation of functional categories (described by KEGG and REACTOME pathways and Gene Ontology: Biological Process, Molecular Function and Cellular Component) for the list of genes (n = 3241) that showed statistically significant differential expression, of at least +/− 1.25-fold, between the muscle tissue (gluteus medius) from the untrained rest (UR) and the untrained exercise (UE) Thoroughbred cohorts. Bars represent the most significant functional modules (up to 20) for each of the five annotation schemas. Bar height represents statistical significance (−log 10 transformed Benjamini-Hochberg (B-H) Corrected P-value) of the over-representation, based on the EASE-score (conservative Fisher Exact t-test). Bar color represents the mean differential expression (log2(UE/UR) for the genes in this module (see color key). Category name, ID and size (number category genes in gene list/category size) are given above each bar. For example it can be seen that the fourth most significant Gene Ontology:Biological Process is ‘Cellular respiration’ and that it is one of the most up-regulated functional categories on average (red color) and that 39 out of the 97 genes assigned to this category are differentially expressed between UE and UR cohorts. Full results are provided in Additional file 2: Table S3
Fig. 2
Fig. 2
Cellular functions of the exercise-specific response. Bar charts showing over-representation of functional categories (described by KEGG and REACTOME pathways and Gene Ontology: Biological Process, Molecular Function and Cellular Component) for the list of genes (n = 2216) that showed statistically significant differential expression, of at least +/− 1.25-fold, between the muscle tissue (gluteus medius) from the untrained rest (UR) and the untrained exercise (UE) but not the trained rest (TR) Thoroughbred cohorts. Bars represent the most significant functional modules (up to 20) for each of the five annotation schemas. Bar height represents statistical significance (−log 10 transformed Benjamini-Hochberg (B-H) Corrected P-value) of the over-representation, based on the EASE-score (conservative Fisher Exact t-test). Bar color represents the mean differential expression (log2(UE/UR) for the genes in this module (see color key). Category name, ID and size (number category genes in gene list/category size) are given above each bar. For example it can be seen that the most significant Reactome pathway is ‘Muscle contraction’ and that it is one of the most down-regulated functional categories on average (blue color) and that 16 out of the 31 genes assigned to this category are differentially expressed between UE and UR cohorts only (i.e. not differentially expressed between TR and UR cohorts). Full results are provided in Additional file 2: Table S4
Fig. 3
Fig. 3
Cellular functions of the training response. Bar charts showing over-representation of functional categories (described by KEGG and REACTOME pathways and Gene Ontology: Biological Process, Molecular Function and Cellular Component) for the list of genes (n = 3405) that showed statistically significant differential expression, of at least +/− 1.25-fold, between the muscle tissue (gluteus medius) from the untrained rest (UR) and the trained rest (TR) Thoroughbred cohorts. Bars represent the most significant functional modules (up to 20) for each of the five annotation schemas. Bar height represents statistical significance (−log 10 transformed Benjamini-Hochberg (B-H) Corrected P-value) of the over-representation, based on the EASE-score (conservative Fisher Exact t-test). Bar color represents the mean differential expression (log2(TR/UR) for the genes in this module (see color key). Category name, ID and size (number category genes in gene list/category size) are given above each bar. For example it can be seen that the most significant Gene Ontology:Biological Process is ‘Integration of energy metabolism’ and that this functional categories is up-regulated on average (orange color) and that 95 out of the 219 genes assigned to this category are differentially expressed between TR and UR cohorts. Full results are provided in Additional file 2: Table S5
Fig. 4
Fig. 4
Cellular functions of the training-specific response. Bar charts showing over-representation of functional categories (described by KEGG and REACTOME pathways and Gene Ontology: Biological Process, Molecular Function and Cellular Component) for the list of genes (n = 2380) that showed statistically significant differential expression, of at least +/− 1.25-fold, between the muscle tissue (gluteus medius) from the untrained rest (UR) and the trained rest (TR) but not the untrained exercise (UE) Thoroughbred cohorts. Bars represent the most significant functional modules (up to 20) for each of the five annotation schemas. Bar height represents statistical significance (−log 10 transformed Benjamini-Hochberg (B-H) Corrected P-value) of the over-representation, based on the EASE-score (conservative Fisher Exact T-Test). Bar color represents the mean differential expression (log2(UE/UR) for the genes in this module (see color key). Category name, ID and size (number category genes in gene list/category size) are given above each bar. For example it can be seen that the most significant Reactome pathway is ‘Signaling by GPCR’ (where GPCR = G protein-coupled receptors) and that it is one of the most up-regulated functional categories on average (orange color) and that 186 out of the 631 genes assigned to this category are differentially expressed between TR and UR cohorts only (i.e. not differentially expressed between UE and UR cohorts). Full results are provided in Additional file 2: Table S6
Fig. 5
Fig. 5
Pipeline for construction of putative dynamic PPI networks in the exercise and training responses. Each putative contextual PPI network is composed from nodes, V, (genes) and edges, E, (interactions) related to one of the experimental contexts (cohorts). For example, the putative PPI network for the exercise in the untrained rest state, (1): G = (V UE, E UR ), contains the nodes (genes) that are associated with exercise (VUE) and the edges (based on gene expression correlations) from the untrained rest (EUR) cohort that are also supported by known protein-protein interactions (PPIs) in the IntAct molecular interaction database. This can be considered the ‘ground state’ of the dynamic exercise network and can be compared to the exercise ‘active state’, (2): G = (V UE, E UE ), or the sub-network that is exclusive to exercise, (3):G = (V UE – TR ,E UE ) to model how these putative PPI interactions might be re-wired in the exercise response and the exercise-specific response respectively. Networks (1)–(3) are illustrated in Fig. 6(a)-(c) and networks (4)–(6) are illustrated in Fig. 7(a)-(c)
Fig. 6
Fig. 6
Putative dynamic PPI network for the exercise response. a The putative PPI network for exercise rest or ‘ground state’ contains 513 nodes (genes), after edgeless nodes were removed, and 514 edges (interactions)(see also Fig. 5 and Methods). This network was partitioned by Newman’s fastgreedy community detection (based on network topology only and with no prior information relating to gene function) into forty-three communities or node ‘clusters’. A subset of twenty-eight of these clusters had greater than two nodes (genes) and were found to be significantly enriched for at least one functional category (described by KEGG, Reactome or Gene Ontology). Node colour and shape (i.e. circle, square, up-pointing triangle and down-pointing triangle) signifies cluster membership (only functionally enriched cluster shown in legend). Node size is proportional to node ‘betweeness’ score, with the largest nodes ‘controlling’ the most network ‘traffic’ (along shortest paths). The top twenty ‘bottleneck’ nodes have white labels. b The network for the exercise state, which contains 426 nodes (genes), after edgeless nodes are removed, and 390 edges (interactions). Nodes (genes) are both up (‘+’ nodes) and down-regulated (‘-’ nodes) and ‘re-wired’ (loss/gain of edges) in the exercise response compared to the rest state depicted in (a). Cluster membership from (a) is transposed onto (b) to highlight how each cluster changes in the exercise network state (i.e. common nodes are given the same colour and shape with new nodes depicted by uncoloured circles). For example, it can be seen that Cluster 1 (red circles), which is most enriched for the ‘Contractile fiber’ functional category becomes extensively fragmented into 10 (mostly two-node) clusters and most genes are down-regulated (19/26) signifying possible dysregulation of this functional modules in the exercise response. Conversely we also see that the Cluster 6 (yellow circles), which is most enriched for ‘NADH dehydrogenase/ Mitochondrial respiratory chain complex I’, is mostly up-regulated and remains largely intact, signifying possible coordinated up-regulation of this functional module in the exercise response. c Depicts the sub-network of (b) whose nodes (genes) are exclusive to the exercise response (i.e. not associated with the training response)
Fig. 7
Fig. 7
Putative dynamic PPI network for the training response. a The putative PPI network for untrained or ‘ground state’ contains 199 nodes (genes), after edgeless nodes were removed, and 186 edges (interactions)(see also Fig. 5 and Methods). This network was partitioned by Newman’s fastgreedy community detection (based on network topology only and with no prior information relating to gene function) into forty-three communities or node ‘clusters’. A subset of twenty-eight of these clusters had greater than two nodes (genes) and were found to be significantly enriched for at least one functional category (described by KEGG, Reactome or Gene Ontology). Node colour and shape (i.e. circle, square, up-pointing triangle and down-pointing triangle) signifies cluster membership (only functionally enriched cluster shown in legend). Node size is proportional to node ‘betweeness’ score, with the largest nodes ‘controlling’ the most network ‘traffic’ (along shortest paths). The top twenty ‘bottleneck’ nodes have white labels. b The network for the trained state, which contains 188 nodes (genes), after edgeless nodes are removed, and 176 edges (interactions). Nodes (genes) are both up (‘+’ nodes) and down-regulated (‘-’ nodes) and ‘re-wired’ (loss/gain of edges) in the training response compared to the untrained state depicted in (a). Cluster membership from (a) is transposed onto (b) to highlight how each cluster changes in the trained network state (i.e. common nodes are given the same colour and shape with new nodes depicted by uncoloured circles). For example, it can be seen that Cluster 2 (green circles), which is most enriched for the ‘ErbB signaling pathway/Signaling by PDGF’ functional category becomes fragmented into 4 clusters and all visible genes (edgeless nodes are not depicted) are down-regulated. Conversely we see that the Cluster 1 (red circles), which is most enriched for ‘NADH dehydrogenase/ Mitochondrial respiratory chain complex I’, is mostly up-regulated and remains largely intact, signifying possible coordinated up-regulation of this functional module in the training response. c Depicts the sub-network of (b) whose nodes (genes) are exclusive to the training response (i.e. not associated with the exercise response)

References

    1. Hinchcliff KW, Kaneps AJ, Geor RJ. Equine exercise physiology: the science of exercise in the athletic horse. New York. Edinburgh: Saunders/Elsevier; 2008.
    1. Dingboom EGDG, Enzerink E, van Oudheusden HC, Weijs WA. Postnatal muscle fibre composition of the gluteus medius muscle of Dutch Warmblood foals; maturation and the influence of exercise. Equine Vet J. 1999;31(Suppl):95–100. - PubMed
    1. Rivero JLL, Talmadge RJ, Edgerton VR. Correlation between myofibrillar ATPase activity and myosin heavy chain composition in equine skeletal muscle and the influence of training. Anat Rec. 1996;246(2):195–207. doi: 10.1002/(SICI)1097-0185(199610)246:2<195::AID-AR6>3.0.CO;2-0. - DOI - PubMed
    1. Coffey VG, Hawley JA. The molecular bases of training adaptation. Sports Med. 2007;37(9):737–763. doi: 10.2165/00007256-200737090-00001. - DOI - PubMed
    1. Serrano A, Quiroz-Rothe E, Rivero J-L. Early and long-term changes of equine skeletal muscle in response to endurance training and detraining. Pflugers Arch. 2000;441(2–3):263–274. doi: 10.1007/s004240000408. - DOI - PubMed

Publication types

LinkOut - more resources