. 2017 Nov 1;118(5):2789-2805.
doi: 10.1152/jn.00253.2017. Epub 2017 Aug 9.

Sequential hemifield gating of α- and β-behavioral performance oscillations after microsaccades

Affiliations

Sequential hemifield gating of α- and β-behavioral performance oscillations after microsaccades

Joachim Bellet et al. J Neurophysiol. .

Abstract

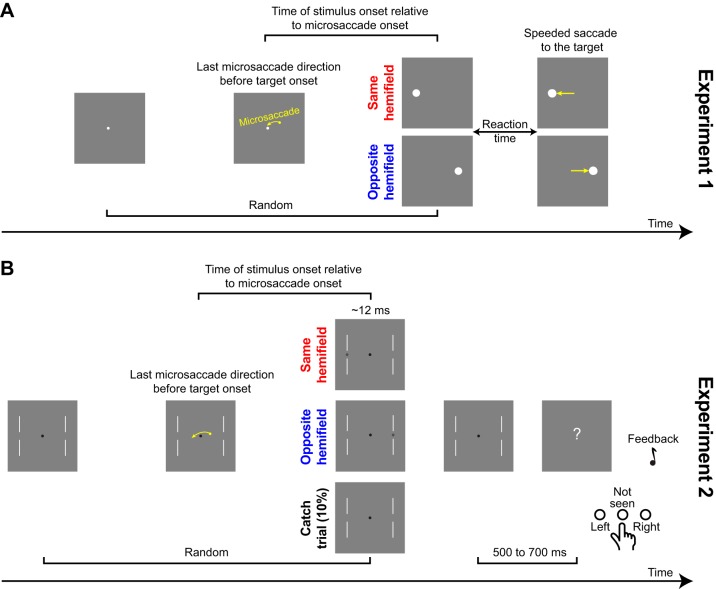
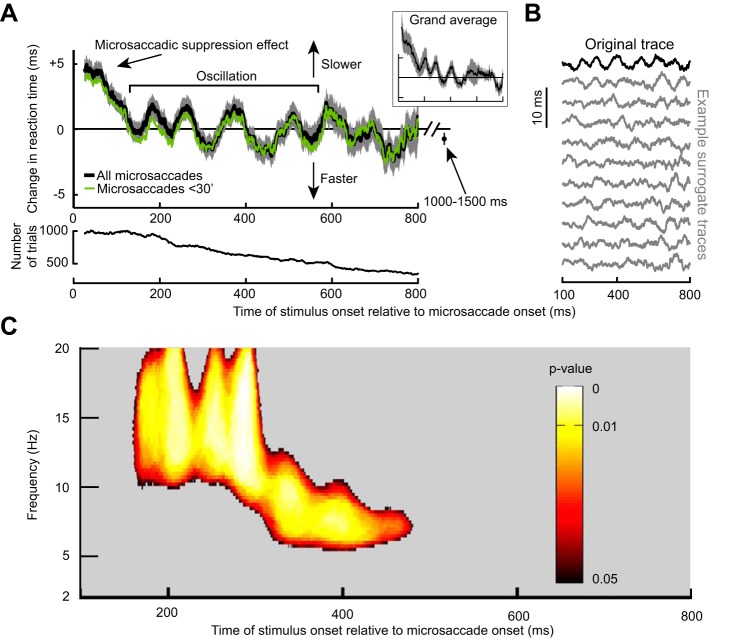
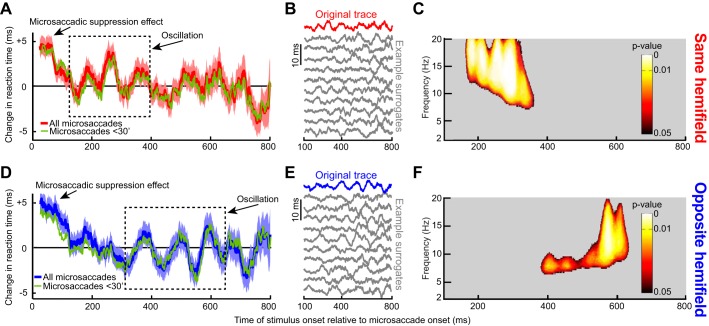
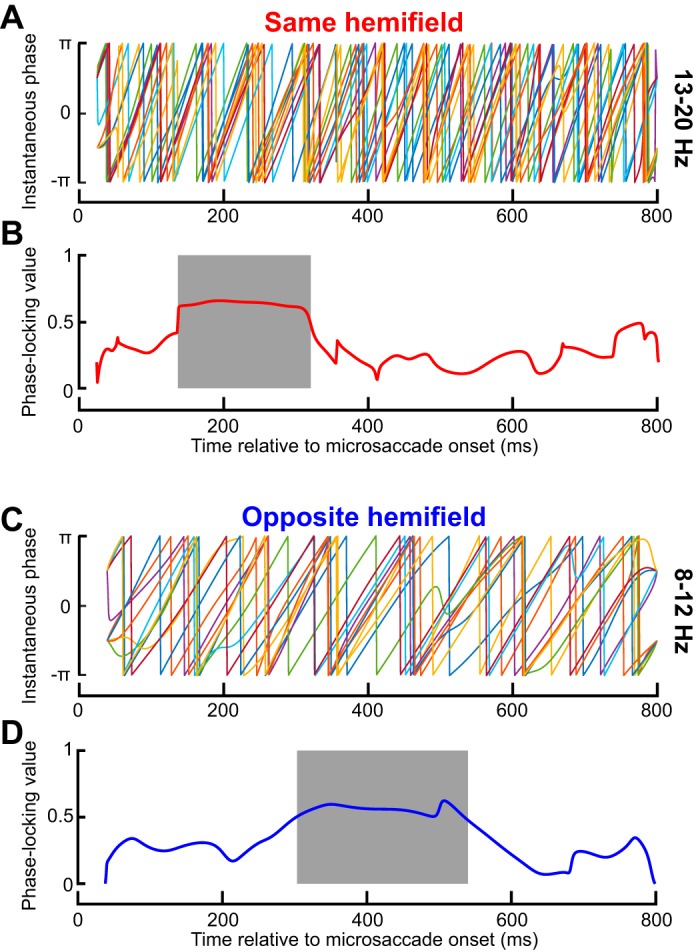
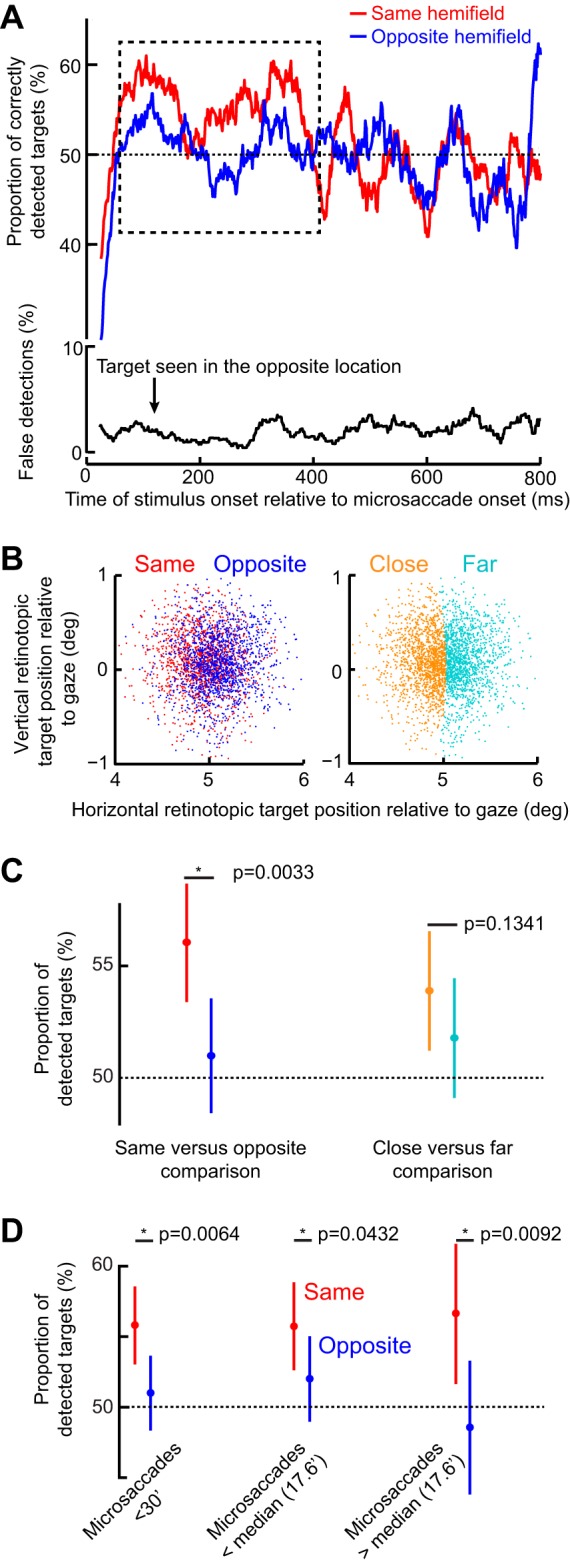
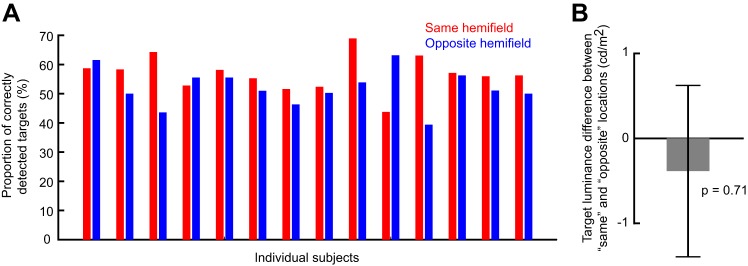
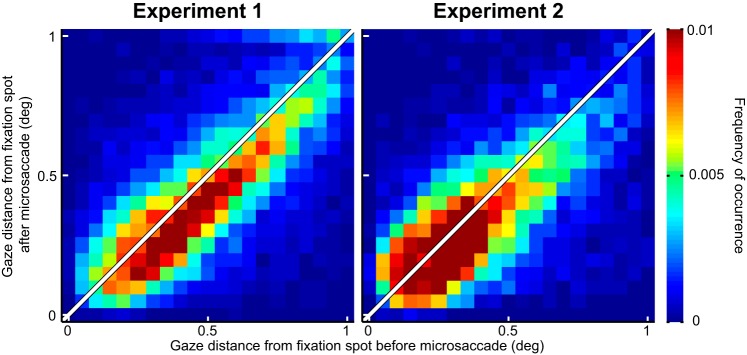
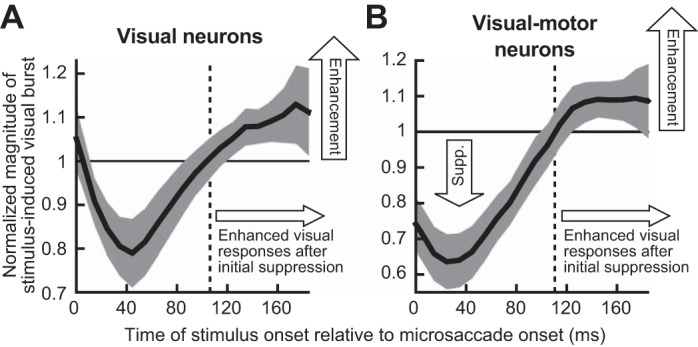
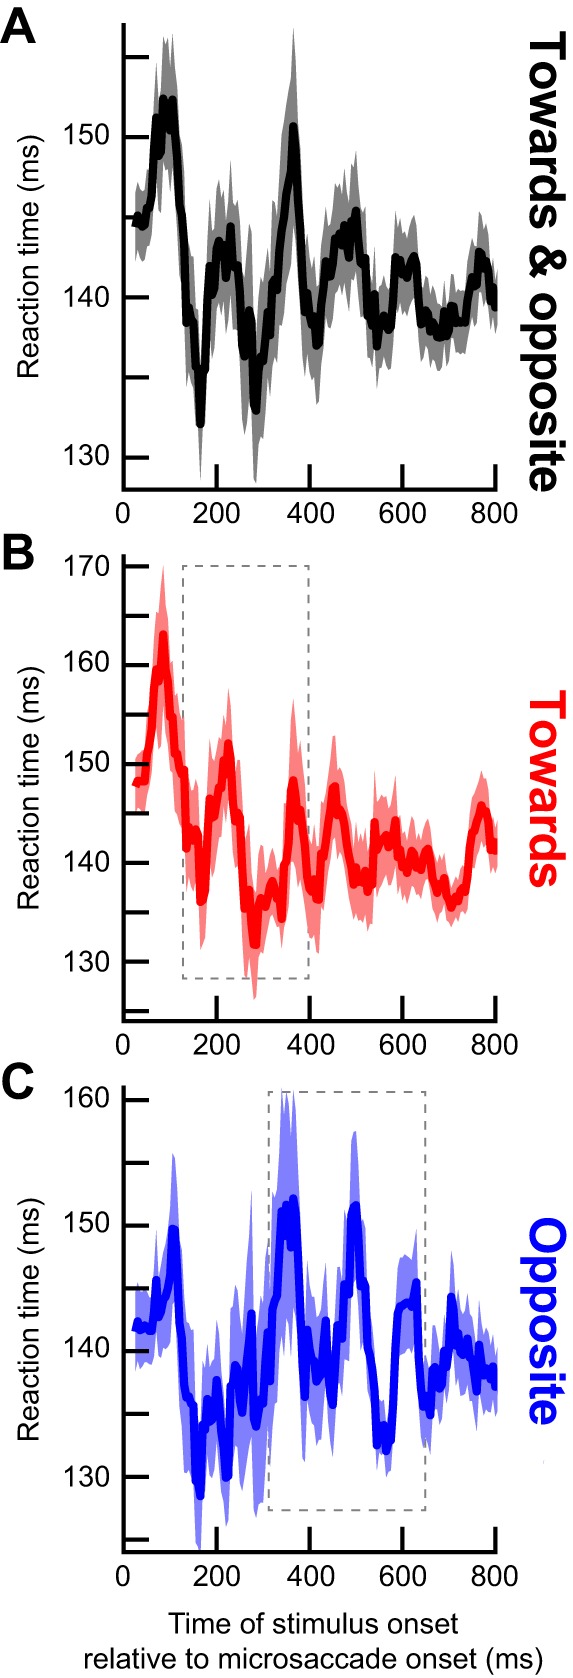
Microsaccades are tiny saccades that occur during gaze fixation. Even though visual processing has been shown to be strongly modulated close to the time of microsaccades, both at central and peripheral eccentricities, it is not clear how these eye movements might influence longer term fluctuations in brain activity and behavior. Here we found that visual processing is significantly affected and, in a rhythmic manner, even several hundreds of milliseconds after a microsaccade. Human visual detection efficiency, as measured by reaction time, exhibited coherent rhythmic oscillations in the α- and β-frequency bands for up to ~650-700 ms after a microsaccade. Surprisingly, the oscillations were sequentially pulsed across visual hemifields relative to microsaccade direction, first occurring in the same hemifield as the movement vector for ~400 ms and then the opposite. Such pulsing also affected perceptual detection performance. Our results suggest that visual processing is subject to long-lasting oscillations that are phase locked to microsaccade generation, and that these oscillations are dependent on microsaccade direction.NEW & NOTEWORTHY We investigated long-term microsaccadic influences on visual processing and found rhythmic oscillations in behavioral performance at α- and β-frequencies (~8-20 Hz). These oscillations were pulsed at a much lower frequency across visual hemifields, first occurring in the same hemifield as the microsaccade direction vector for ~400 ms before switching to the opposite hemifield for a similar interval. Our results suggest that saccades temporally organize visual processing and that such organization can sequentially switch hemifields.

Keywords: fixational eye movements; microsaccades; perceptual oscillations; α-rhythms; β-rhythms.


Figures

Fig. 1.
Fig. 1.
Behavioral tasks. A: experiment 1. Subjects generated a target-directed saccade. Before target onset, subjects could generate a microsaccade either toward the same or opposite hemifield as the target. We analyzed reaction time (RT) as a function of target onset time and direction relative to microsaccades, and we ensured that there were no intervening movements (saccades or microsaccades) or blinks between the microsaccade of interest and target onset. B: experiment 2. Subjects detected a target at threshold by indicating its location (or that they did not see any target). Task difficulty was continuously adjusted to keep conscious target detections at ~50% (see materials and methods).
Fig. 2.
Fig. 2.
Steps used for time-frequency analyses in our study. A: we collected all trials and plotted each trial’s RT (as in the case of experiment 1) as a function of target onset time relative to a microsaccade. In this illustrative example, we show artificial data that have an underlying oscillatory pulse embedded in noise. Bottom: we shuffled the data in time, and we did this 1,000 times to obtain 1,000 surrogate data sets. B: we filtered the data using a running average to obtain a time course of fluctuations in the real data (top) and also for each of the 1,000 surrogate data sets. C: we then convolved each of the time course traces with a complex Gaussian wavelet of order 4. D: this allowed us to obtain time-frequency power spectra. For the real data, high power was observed during the interval in which an oscillation pulse was present in the original signal. The surrogate data sets had high power at random places in the time-frequency plots. E: we established statistical significance, with corrections for multiple comparisons, by finding a cluster in 2-dimensional time-frequency space in the original data set that was unlikely to be observed by chance from similar clusters observed in the surrogate data sets. We then plotted this “outlying” cluster with its associated P values as the significant cluster of spectrotemporal oscillation.
Fig. 3.
Fig. 3.
Long-term microsaccadic influence on RT. A: change in mean RT as a function of target onset time relative to a microsaccade. This trace shows the demeaned RT trace before detrending (see materials and methods). After an initial ~100-ms period of RT costs (i.e., increases) due to “microsaccadic suppression,” RT oscillated coherently for almost 600 ms. Error bars denote SE across all trials from all subjects combined (see materials and methods), and we used a running window of 50 ms (in steps of 1 ms); the inset shows that we obtained very similar RT fluctuations when individual subject data were first averaged into a single subject trace and then all the single subject traces averaged together to obtain a grand average. The bottom shows the number of trials used per time bin in the top and using the same running window procedure. Also, the green trace shows results from only trials with microsaccades less than a 30-min arc in amplitude. Note that the RT oscillation (and subsequent measurement for 1,000–1,500 ms shown as an individual data point) hovered slightly below 0. This is because the total average used to demean RT included all trials even those with target onset <300 ms from fixation spot onset; because these early trials almost always had a microsaccade (e.g., Fig. 4C), they had long RTs due to microsaccadic suppression, and this elevated the average RT value slightly. B: the top trace in black is the original demeaned and detrended RT trace from the same data in A. Below this trace are 10 example surrogate traces according to the permutation procedures of Fig. 2A. Our goal was to establish statistically whether oscillations in the original trace that are visible by inspection were not ones expected by chance as might happen in some of the surrogate traces. C: power spectrum of the trace in A during the interval following the initial microsaccadic suppression period of 100 ms. Colored pixels indicate times and frequency bands with a significant oscillation that is not expected by chance from the surrogate traces (Fig. 2; see materials and methods).
Fig. 4.
Fig. 4.
The RT oscillation in Fig. 3 was not due to either intrinsic microsaccadic rhythms or visual transients associated with the onset of the fixation spot at trial beginning. A: the black curve shows mean eye velocity after the last detected microsaccade before target onset from all trials in Fig. 3. For comparison, the dashed gray curve shows mean eye velocity after any given microsaccade irrespective of whether there were subsequent microsaccades or not (from a similar number of trials). The black curve is characterized by an absence of positive-going fluctuations in eye velocity after the first microsaccade (at 0 ms), whereas the gray curve shows elevations peaking at ~200 ms and persisting later, consistent with the likelihood of observing subsequent microsaccades (also see B). A similar result was also obtained for experiment 2. B: distribution of intermicrosaccadic intervals in experiment 1. If 2 microsaccades occurred before target onset, the time between the final microsaccade and target onset contributed to our analyses (Fig. 1A), but the time between the two microsaccades allowed us to estimate intrinsic microsaccadic rhythms. As can be seen from the histogram, intrinsic microsaccadic rhythms might predict dominant oscillations of ~5 Hz or less, which is lower than any of the oscillations that we observed in our data (> 7 Hz; also see Fig. 5). C: microsaccade rate after fixation spot onset. In the interval >300 ms after fixation spot onset, microsaccade rate was constant. We chose to analyze only trials in which the last microsaccade before target onset occurred >300 ms after the beginning of any given trial, to make sure that the effects presented in this study were not phase locked to fixation spot onset. Similar results were obtained from experiment 2.
Fig. 5.
Fig. 5.
Dependence of RT oscillations on microsaccade direction. A: same analysis as in Fig. 3A but only for trials with the target appearing in the same hemifield as a microsaccade. There was an initial microsaccadic suppression effect, followed by an oscillation. However, the oscillation only lasted for up to ~400 ms as indicated by the dashed rectangle, which highlights a pulse of statistically significant RT oscillation (see C). B: original and example surrogate traces from the data in A, as in Fig. 3B. C: same analysis as in Fig. 3C illustrating that the statistically significant RT oscillation pulse was restricted to only the first part of our sampled period after microsaccades. DF: same as AC but for targets appearing in the opposite hemifield. In this case, the RT oscillation pulse was delayed relative to AC (dashed rectangle in D; also see F for the statistically significant times and frequencies). Thus, when separating microsaccade directions, we found that the long-term RT oscillation in Fig. 3 reflected sequential hemifield gating of RT oscillatory pulses first in the same hemifield as a microsaccade and then in the opposite hemifield. Moreover, the effect was consistent across individual subjects (Fig. 6). Green traces show the RT time courses for microsaccades less than a 30-min arc in amplitude.
Fig. 6.
Fig. 6.
Consistency of same- and opposite-hemifield RT oscillation pulses across individual subjects. A: phase of 13- to 20-Hz oscillations for each subject. Phase was largely consistent across subjects during the initial same-hemifield RT pulse of Fig. 5A, C, but it was inconsistent later. B: phase-locking value (PLV; see materials and methods) of the phase traces shown in A. The shaded region shows the interval with significant PLV (P < 0.05; see materials and methods), which was consistent with the early pulse in Fig. 5, A and C. Thus the results in Fig. 5, A and C, were reliable across individual subjects. C: similar analyses but for opposite hemifield trials. Once again, phase was consistent across individuals but only in the late period in which the opposite-hemifield RT oscillation pulse occurred in Fig. 5, D and F; also see D. Thus the opposite-hemifield RT oscillation pulse in Fig. 5, D and F, was consistently observed across individual subjects. D: same as in B but for the data in C.
Fig. 7.
Fig. 7.
Same-hemifield advantage in detectability during the period of the initial RT pulse. A, top: mean detectability (i.e., correct responses) as a function of time after microsaccade onset. Immediately after microsaccades, detectability was impaired, consistent with microsaccadic suppression effects (see materials and methods). However, in the dashed rectangle, which corresponds closely with the same-hemifield RT pulse in Fig. 5, A and C, detectability was significantly higher for targets appearing in the same hemifield as a microsaccade than for opposite targets (P = 0.0033; 2-proportion z-test). A, bottom: incorrect target localizations, which were rare and unmodulated by microsaccadic suppression, suggesting that subjects followed task instructions (also see results). B: retinotopic target position at the time of target onset for trials in the early (100–400 ms) interval after microsaccade onset (each dot is a trial). Positions are colored based on the direction of the last microsaccade relative to the target (left) or whether the target was closer or farther than the median Euclidean distance observed. C: mean detectability during the early (100–400 ms) period. The left pair compares conditions when the target was presented in the same or opposite hemifield relative to a microsaccade. The right pair compares closer or farther targets from the fovea. Detectability was only enhanced in the same hemifield condition (left) and did not depend on retinotopic target position (right). D: mean detectability as in C but now only when microsaccades were less than a 30-min arc in amplitude or when they were smaller or bigger than the median. In all cases, the same-hemifield advantage of A was observed. Error bars denote 95% confidence intervals.
Fig. 8.
Fig. 8.
Individual subject data and same vs. opposite target contrasts in experiment 2. A: mean detectability for each subject and each target hemifield location relative to microsaccade direction in the perceptual detection task. This analysis is restricted to the early period (100–400 ms) after microsaccade onset, which is the period in which we observed differential detection performance across hemifields (Fig. 7). Note that 11 out of the 14 subjects detected the target better when it was presented in the same hemifield as the microsaccade, consistent with the overall population average results in Fig. 7. Thus no outlier subject minority was responsible for the differences observed in Fig. 7 when the data were averaged across all participants. B: difference in target contrast between same and opposite trials in the early period. There was no statistically significant difference (P = 0.71; t-test), suggesting that the performance differences in Fig. 7 were not due to differences in target contrast. Error bar denotes SE.
Fig. 9.
Fig. 9.
Microsaccades acted to primarily correct for foveal motor errors during gaze fixation. We plotted gaze distance from the fixation spot before and after microsaccades, for all microsaccades that were used in the analyses of Figs. 3, 5, and 7. During both experiments, microsaccades brought gaze closer to the fixation spot than before the movements (P = 1.2111 × 10−54 in experiment 1 and P = 6.9096 × 10⁻²⁹ in experiment 2; Wilcoxon rank sum test), consistent with recent observations in previous studies. This suggests that our microsaccades were not necessarily reflecting endogenous attention shifts towards the periphery but were instead part of a deliberate oculomotor strategy to optimize eye position on the fixated target.
Fig. 10.
Fig. 10.
Neural implications of an RT oscillation after initial microsaccadic suppression. A: we performed time course analyses of visual response strength in superior colliculus (SC) purely visual neurons. The neurons were the same as those used in Chen et al. (2015), and the analysis was identical to that performed in Hafed and Krauzlis (2010), except that we extended the analysis window beyond the typical 100 ms after microsaccade onset that we had used earlier (see materials and methods). This allowed us to explore whether recovery from neural microsaccadic suppression is towards a constant baseline or not, as we did in the behavioral experiment of Fig. 1. Error bars denote 95% confidence intervals. As can be seen, after the initial ~100 ms of neural suppression, visual response strength was enhanced (i.e., the curve went above 1), rather than being equal to “baseline,” suggesting that RT oscillations like in Fig. 3 can reflect oscillations in visual neural sensitivity. B: a similar observation was made for visual sensitivity of visual-motor SC neurons, which are better correlated to RT (Chen and Hafed 2017; Hafed and Krauzlis 2010). In A and B, the “baseline” response (normalized to 1) was obtained from trials in which there were no microsaccades within ±150 ms from stimulus onset. Note that this data set did not allow us to sample neural sensitivity for longer periods after a microsaccade (as in Fig. 3), but the postsuppression enhancement nonetheless suggests that visual neural fluctuations can also go above baseline, consistent with the Fig. 3 RT oscillation.
Fig. 11.
Fig. 11.
RT fluctuations within an individual monkey subject. We ran monkey N on 11 sessions of a version of experiment 1. A target like in experiment 1 could appear at random times after microsaccades, but it could appear at one of eight different equally spaced directions. We defined microsaccades as being towards or opposite the target if their directions were within ±22.5° from the direction of the target or the direction diametrically opposite it. A: an analysis like that in Fig. 3 (with a 50-ms running window in 5-ms steps) revealed RT fluctuations similar to those in Fig. 3, with multiple peaks at different times; thus multiple peaks of RT variability can indeed happen within an individual subject. Discrete Fourier transform analysis on the shown interval revealed a spectral peak at ~7.7 Hz. B and C: we repeated the analysis for cases in which the target appeared in a direction congruent with microsaccade direction (“Towards”) or opposite it (“Opposite”). The highest amplitude RT fluctuations occurred early for “Towards” microsaccades and later for “Opposite” movements, just like in Fig. 5. As a reference, the thin gray rectangles show the time intervals in which our average analyses in humans showed significant oscillatory pulses in similar conditions (Fig. 5). This monkey showed similar patterns to the pooled human data. Error bars denote SE across trials, and the figure is formatted similarly to Figs. 3 and 5.

References

    1. Bastos AM, Briggs F, Alitto HJ, Mangun GR, Usrey WM. Simultaneous recordings from the primary visual cortex and lateral geniculate nucleus reveal rhythmic interactions and a cortical source for γ-band oscillations. J Neurosci 34: 7639–7644, 2014. doi:10.1523/JNEUROSCI.4216-13.2014. - DOI - PMC - PubMed
    1. Benedetto A, Morrone MC. Saccadic suppression is embedded within extended oscillatory modulation of sensitivity. J Neurosci 37: 3661–3670, 2017. doi:10.1523/JNEUROSCI.2390-16.2016. - DOI - PMC - PubMed
    1. Benedetto A, Spinelli D, Morrone MC. Rhythmic modulation of visual contrast discrimination triggered by action. Proc Biol Sci 283: 283, 2016. doi:10.1098/rspb.2016.0692. - DOI - PMC - PubMed
    1. Bosman CA, Womelsdorf T, Desimone R, Fries P. A microsaccadic rhythm modulates gamma-band synchronization and behavior. J Neurosci 29: 9471–9480, 2009. doi:10.1523/JNEUROSCI.1193-09.2009. - DOI - PMC - PubMed
    1. Breitmeyer BG. Simple reaction time as a measure of the temporal response properties of transient and sustained channels. Vision Res 15: 1411–1412, 1975. doi:10.1016/0042-6989(75)90200-X. - DOI - PubMed

Publication types

LinkOut - more resources