. 2017 Nov 1;118(5):2549-2567.
doi: 10.1152/jn.00465.2017. Epub 2017 Aug 9.

Limbic-motor integration by neural excitations and inhibitions in the nucleus accumbens

Affiliations

Limbic-motor integration by neural excitations and inhibitions in the nucleus accumbens

Sara E Morrison et al. J Neurophysiol. .

Abstract

The nucleus accumbens (NAc) has often been described as a "limbic-motor interface," implying that the NAc integrates the value of expected rewards with the motor planning required to obtain them. However, there is little direct evidence that the signaling of individual NAc neurons combines information about predicted reward and behavioral response. We report that cue-evoked neural responses in the NAc form a likely physiological substrate for its limbic-motor integration function. Across task contexts, individual NAc neurons in behaving rats robustly encode the reward-predictive qualities of a cue, as well as the probability of behavioral response to the cue, as coexisting components of the neural signal. In addition, cue-evoked activity encodes spatial and locomotor aspects of the behavioral response, including proximity to a reward-associated target and the latency and speed of approach to the target. Notably, there are important limits to the ability of NAc neurons to integrate motivational information into behavior: in particular, updating of predicted reward value appears to occur on a relatively long timescale, since NAc neurons fail to discriminate between cues with reward associations that change frequently. Overall, these findings suggest that NAc cue-evoked signals, including inhibition of firing (as noted here for the first time), provide a mechanism for linking reward prediction and other motivationally relevant factors, such as spatial proximity, to the probability and vigor of a reward-seeking behavioral response.NEW & NOTEWORTHY The nucleus accumbens (NAc) is thought to link expected rewards and action planning, but evidence for this idea remains sparse. We show that, across contexts, both excitatory and inhibitory cue-evoked activity in the NAc jointly encode reward prediction and probability of behavioral responding to the cue, as well as spatial and locomotor properties of the response. Interestingly, although spatial information in the NAc is updated quickly, fine-grained updating of reward value occurs over a longer timescale.

Keywords: electrophysiology; locomotion; motivation; nucleus accumbens; reward.


Figures

Fig. 1.
Fig. 1.
Distinct subpopulations of NAc neurons exhibit cue-evoked excitations and cue-evoked inhibitions that precede behavioral responses. Individual neurons in the NAc were recorded during a discriminative stimulus (DS) task (A) or a decision-making (DM) task (B). The DM task also included 2 blocks per session in which reward was held constant and effort requirement was varied (not shown). C: average behavioral response rate in the DS task (left) and DM task (right). D and E: average normalized firing rate, aligned on cue onset, among all neurons exhibiting cue-evoked excitatory (D) or inhibitory responses (E). Magenta stars indicate median motion onset time (i.e., start of approach toward the lever) within the session in which the cell was recorded. The large majority of cue-evoked excitations and inhibitions begin (and in many cases end) before most motion onset times.
Fig. 2.
Fig. 2.
Cue-evoked excitations and inhibitions encode reward prediction in a DS task. A, B, E, and F: examples of a cell exhibiting cue-evoked excitation (A, B) and a cell exhibiting cue-evoked inhibition (E, F), each of which responds more strongly to the reward-predictive DS cue (A, E) than to the unrewarded NS cue (B, F). C and G: population average cue-evoked response among cells with cue-evoked excitations (C) and inhibitions (G). Black solid line, DS trials; gray dashed line, NS trials; shading, SE. D and H: distribution of reward prediction index among cue-excited cells (D) and cue-inhibited cells (H). Index >0.5 indicates higher firing rate on DS trials; index <0.5 indicates higher firing rate on NS trials. Dark gray bars indicate significant index (P ≤ 0.05, permutation test). Arrowhead indicates median of each distribution.
Fig. 3.
Fig. 3.
Cue-evoked excitations and inhibitions exhibit minimal encoding of reward magnitude in a decision-making task. A, B, E, and F: examples of a cell exhibiting cue-evoked excitation (A, B) and a cell exhibiting cue-evoked inhibition (E, F), each of which shows little difference in response to a cue predicting large reward (A, E) or small reward (B, F) during forced-choice trials. C and G: population average cue-evoked response among cells with cue-evoked excitations (C) and inhibitions (G). Black solid line, large-reward forced-choice trials; gray dashed line, small-reward forced-choice trials; shading, SE. Among inhibitions only, there is significantly higher firing (i.e., less inhibition) on small-reward trials in the time period 100–300 ms following cue onset. D and H: distribution of reward magnitude index among cue-excited cells (D) and cue-inhibited cells (H). Index >0.5 indicates higher firing rate on large-reward trials; index <0.5 indicates higher firing rate on small-reward trials. Dark gray bars indicate significant index (P ≤ 0.05, permutation test). Arrowhead indicates median of each distribution.
Fig. 4.
Fig. 4.
Cue-evoked excitations and inhibitions exhibit little stable encoding of reward information in the DM task, in contrast to the DS task. A and B: reward magnitude index comparing responses to the same lever (left or right) when its extension predicts large vs. small reward. Index for left lever is plotted against index for right lever within the same session for excitations (A) and inhibitions (B). C and D: reward magnitude index comparing responses to the large-reward-predictive and small-reward-predictive lever during the same block of trials. Index for chronological block 1 is plotted against index for block 2 within the same session for excitations (C) and inhibitions (D). E and F: reward prediction index comparing responses to the DS cue vs. the NS cue. Index for first half of session (early) is plotted against index for second half of session (late) for excitations (E) and inhibitions (F). In A–F: filled triangles, both indexes significant (P ≤ 0.05, permutation test); open triangles, one index significant; open circles, neither index significant. P values represent results of a McNemar’s test for correlated proportions.
Fig. 5.
Fig. 5.
Cue-evoked excitations and inhibitions encode locomotor features of the behavioral response. A and B: average normalized firing rate during trials with, from left, short or long motion onset latency (bottom vs. top quartile), fast or slow mean motion speed (top vs. bottom quartile), and near or far proximity to a reward-associated lever. Firing rate is shown for cue-evoked excitations in the 200 ms following cue onset (A) and for cue-evoked inhibitions in cell-specific custom response windows (B). *P < 0.05, Wilcoxon rank sum test; **P < 0.001. Error bars, SE. C–J: population average cue-evoked response among cue-excited cells (C, D, G, H) and cue-inhibited cells (E, F, I, J) during the DS task (C, E, G, I) and the DM task (D, F, H, J). In C–F: black solid line, trials with motion onset latency in the bottom quartile (faster); gray dashed line, trials with motion onset latency in the top quartile (slower). In G–J: black solid line, trials with mean movement speed in the top quartile (faster); gray dashed line, trials with mean movement speed in the bottom quartile (slower); shading, SE.
Fig. 6.
Fig. 6.
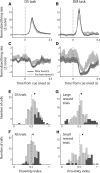
Cue-evoked neural responses encode proximity to a reward-associated lever in concert with reward prediction. A–D: population average cue-evoked response among cue-excited cells (A, B) and cue-inhibited cells (C, D) during the DS task (A, C) and the DM task (B, D). Black solid line, trials in which the subject is located near a reward-associated lever at cue onset; gray dashed line, trials in which the subject is far from a reward-associated lever; shading, SE. E–H: distribution of a proximity index among cue-excited cells in the DS task (E, F) and the DM task (G, H). Proximity index >0.5 indicates higher firing rate when the subject is near a reward-associated lever at cue onset; index <0.5 indicates higher firing rate when the subject is far from a reward-associated lever at cue onset. Dark gray bars indicate significant index (P ≤ 0.05, permutation test). The proximity index is derived from firing rate in the 200 ms following cue onset. Arrowhead indicates median of each distribution. The median of each distribution is significantly shifted from zero (P < 0.05, signed-rank test). The median index is significantly higher for DS trials than for NS trials (P = 0.001, Wilcoxon rank sum test), whereas the median indexes for large-reward trials and small-reward trials are not different (P = 0.24).
Fig. 7.
Fig. 7.
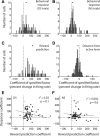
Locomotor characteristics and proximity are independent contributors to variance among cue-evoked excitations and inhibitions. A–F: distributions of coefficients derived from a GLM with factors of motion onset latency (A, D), mean speed (B, E), and distance from a reward-associated lever (C, F) for all cells from both the DS and DM tasks. Each coefficient is derived from the β value associated with the specified factor and normalized as the expected change in firing rate over an interdecile shift in the variable. The GLM was applied to cue-evoked excitations in the 200 ms following cue onset (A–C) and to cue-evoked inhibitions in custom-response windows (D–F). Dark gray bars indicate coefficients derived from significant β values. Arrowhead indicates median of each distribution. The median of each distribution is significantly shifted from zero (P < 0.001, signed-rank test), with the exception of the mean speed coefficient for inhibitions (E).
Fig. 8.
Fig. 8.
In the DS task, cue-evoked firing jointly encodes reward prediction and the subsequent behavioral response. A–D: an example cell shows markedly enhanced cue-evoked excitation when the DS cue is subsequently followed by a lever press (A) than when the DS cue does not elicit a behavioral response (B) or when the cue is not associated with reward (C, D), regardless of subsequent behavioral response. E and F: population average of cue-evoked excitations following the DS cue (E) or the NS cue (F). Black solid line, trials in which the cue was followed by a behavioral response; gray dashed line, behavioral nonresponse trials; shading, SE. G and H: distribution of behavioral response index for excitations on DS and NS trials, respectively. Index >0.5 indicates higher firing rate on trials with a behavioral response; index <0.5 indicates higher firing rate on nonresponse trials. Dark gray bars indicate significant index (P ≤ 0.05, permutation test). Arrowhead indicates median of each distribution. The medians of both distributions are significantly shifted from 0.5 (P < 0.001, signed-rank test) as well as from each other (P < 0.001, Wilcoxon rank sum test). I and J: population average of cue-evoked inhibitions following the DS cue (I) or the NS cue (J). Conventions are as in E and F. K and L: distribution of behavioral response index for inhibitions on DS and NS trials, respectively. Conventions are as in G and H.
Fig. 9.
Fig. 9.
Behavioral response or nonresponse contributes to cue-evoked excitations in the DM task. A and C: population average of cue-evoked excitations following the large-reward cue (A) or small-reward cue (C). Only forced-choice trials are included. Black solid line, trials in which the cue was followed by a behavioral response; gray dashed line, behavioral nonresponse trials; shading, SE. B and D: distribution of behavioral response index for large-reward and small-reward trials, respectively. Index >0.5 indicates higher firing rate on trials with a behavioral response; index <0.5 indicates higher firing rate on nonresponse trials. Dark gray bars indicate significant index (P ≤ 0.05, permutation test). Arrowhead indicates median of each distribution. The medians of both distributions are significantly shifted from 0.5 (large-reward trials: P = 0.004, signed-rank test; small reward trials: P = 0.05) but are not significantly different from each other (P = 0.09, Wilcoxon rank sum test).
Fig. 10.
Fig. 10.
Magnitude of cue-evoked excitation or inhibition contributes to behavioral response probability independently from the reward-predictive quality of the cue. A and B: results of a logistic regression modeling response probability with factors of cue identity (DS or NS) and firing rate for excitations (A) and inhibitions (B). Coefficients for firing rate are shown. Coefficients for cue identity (not shown) were uniformly positive (for excitations) or negative (for inhibitions). Dark gray bars indicate coefficients derived from significant β values. Arrowhead indicates median of each distribution. The median of each distribution is significantly shifted from zero (P < 0.001, signed-rank test). C–F: rank-order analysis in which each of the 4 trial types was assigned rank 1–4 based on firing rate relative to the other trial types (1 representing the highest firing rate and 4 the lowest). The 4 trial types include DS with behavioral response (DS/R), DS with nonresponse (DS/NR), NS with response (NS/R), and NS with nonresponse (NS/NR). C and D: average rank of each of the 4 trial types among excitations (C) and inhibitions (D). E and F: number of cue-excited (E) and cue-inhibited (F) cells recorded, reflecting each of the 24 possible rank orders. Dashed horizontal line represents the number of cells in each category that would be expected by chance.
Fig. 11.
Fig. 11.
Among cue-evoked excitations, reward prediction, behavioral response, and proximity to lever are independent contributors to variance. A–D: distribution of coefficients derived from a GLM with factors of behavioral response on DS trials (A), behavioral response on NS trials (B), reward prediction derived from DS or NS cue identity (C), and distance from the active lever (D). Each coefficient is normalized as the expected change in firing rate over an interdecile shift in the variable (for distance) or a switch in the binary variable (for all other factors). Dark gray bars indicate coefficients derived from significant β values. Arrowhead indicates median of each distribution. The median of each distribution is significantly shifted from zero (P < 0.001, signed-rank test). E and F: reward prediction coefficient (as in C) plotted against behavioral response coefficient (as in A and B) for DS trials (E) and NS trials (F). Solid line is regression line. In neither case is the correlation significant (P > 0.05).
Fig. 12.
Fig. 12.
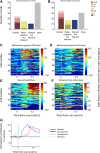
Cue-evoked excitations encode subsequent behavioral response earlier than reward prediction in the DS task. A and B: results of an ANOVA, applied to a 200-ms (A) or 500-ms (B) post-cue time window, incorporating reward prediction (based on DS or NS cue identity), behavioral response/nonresponse, and an interaction factor. I, significant interaction effect; R, significant main effect of reward prediction; B, significant main effect of behavioral response/nonresponse. For all effects, α = 0.05. Note the increased prevalence of reward and/or interaction encoding compared with behavioral response encoding over time. C–F: results of a sliding GLM (200-ms bins slid by 20 ms) with factors of behavioral response on DS trials (C), behavioral response on NS trials (D), reward prediction (E), and distance from the active lever (F). Colors indicate the magnitude of the coefficient for the specified factor (normalized as in Fig. 6). Each row represents a single neuron, and cells are shown in the same order in each plot. G: time course of the contribution to variance of reward (red solid line), behavioral response on DS trials (blue solid line), behavioral response on NS trials (magenta dashed line), and distance from the active lever (cyan dashed line). Contribution to variance is normalized as the baseline-subtracted percent maximum for each coefficient independently.

Similar articles

Cited by

References

    1. Adams CD. Variations in the sensitivity of instrumental responding to reinforcer devaluation. Q J Exp Psychol B 34: 77–98, 1982. doi: 10.1080/14640748208400878. - DOI
    1. Adams CD, Dickinson A. Instrumental responding following reinforcer devaluation. Q J Exp Psychol B 33: 109–121, 1981. doi: 10.1080/14640748108400816. - DOI
    1. Ambroggi F, Ghazizadeh A, Nicola SM, Fields HL. Roles of nucleus accumbens core and shell in incentive-cue responding and behavioral inhibition. J Neurosci 31: 6820–6830, 2011. doi: 10.1523/JNEUROSCI.6491-10.2011. - DOI - PMC - PubMed
    1. Ambroggi F, Ishikawa A, Fields HL, Nicola SM. Basolateral amygdala neurons facilitate reward-seeking behavior by exciting nucleus accumbens neurons. Neuron 59: 648–661, 2008. doi: 10.1016/j.neuron.2008.07.004. - DOI - PMC - PubMed
    1. Berridge KC. The debate over dopamine’s role in reward: the case for incentive salience. Psychopharmacology (Berl) 191: 391–431, 2007. doi: 10.1007/s00213-006-0578-x. - DOI - PubMed

Publication types

LinkOut - more resources