. 2017 Aug 9;8(1):217.
doi: 10.1038/s41467-017-00159-6.

Focal cortical seizures start as standing waves and propagate respecting homotopic connectivity

Affiliations

Focal cortical seizures start as standing waves and propagate respecting homotopic connectivity

L Federico Rossi et al. Nat Commun. .

Abstract

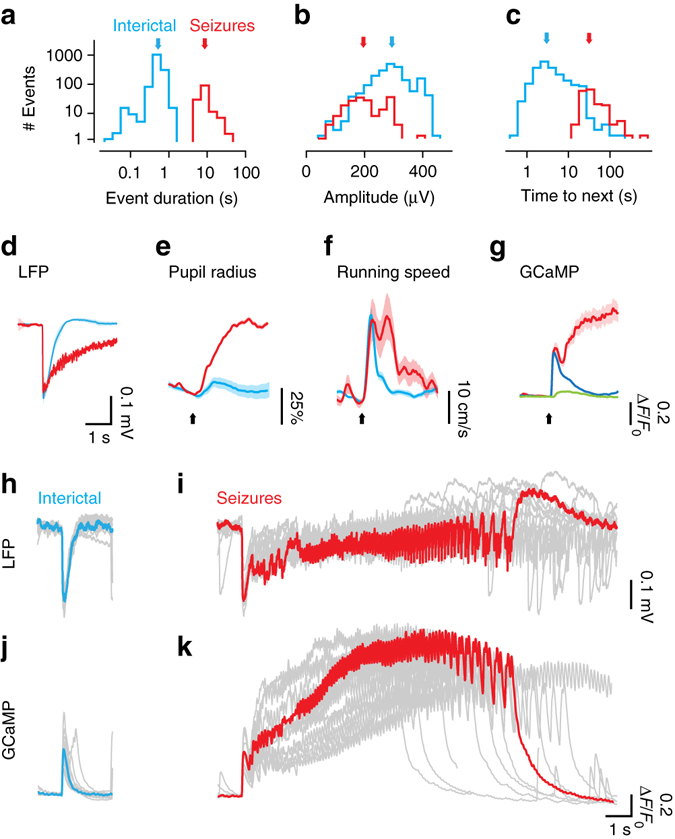
Focal epilepsy involves excessive cortical activity that propagates both locally and distally. Does this propagation follow the same routes as normal cortical activity? We pharmacologically induced focal seizures in primary visual cortex (V1) of awake mice, and compared their propagation to the retinotopic organization of V1 and higher visual areas. We used simultaneous local field potential recordings and widefield imaging of a genetically encoded calcium indicator to measure prolonged seizures (ictal events) and brief interictal events. Both types of event are orders of magnitude larger than normal visual responses, and both start as standing waves: synchronous elevated activity in the V1 focus and in homotopic locations in higher areas, i.e. locations with matching retinotopic preference. Following this common beginning, however, seizures persist and propagate both locally and into homotopic distal regions, and eventually invade all of visual cortex and beyond. We conclude that seizure initiation resembles the initiation of interictal events, and seizure propagation respects the connectivity underlying normal visual processing.Focal cortical seizures result from local and widespread propagation of excitatory activity. Here the authors employ widefield calcium imaging in mouse visual areas to demonstrate that these seizures start as local synchronous activation and then propagate along the connectivity that underlies normal sensory processing.


Conflict of interest statement

The authors declare no competing financial interests.

Figures

Fig. 1
Fig. 1
Testing hypotheses for cortical seizure propagation with simultaneous imaging, recordings and behavioral measurements in the awake mouse. a Cartoon of mouse visual cortex showing six visual areas in the right hemisphere, each containing a map of the left visual field. Colors indicate territories that prefer the same horizontal position. V1 and LM are the primary and secondary visual areas. b Cartoon depicting elevated activity in the seizure focus in V1. Dotted line through the epileptic focus connects V1 and LM regions that prefer the same vertical position. Inset: Profile of activity along that line. c Contiguous propagation hypothesis: local mechanisms make seizure spread radially to nearby territories. Inset: profile of idealized activity at onset (gray) and during spread (blue). d Homotopic propagation hypothesis: long-range connections generate secondary distal foci in homotopic locations in higher visual areas. Inset as in c. e Schematic of the experimental set-up. f Example retinotopic map obtained from a GCaMP6f mouse. Colors indicate preferred horizontal position (color bar). g Image acquired during simultaneous widefield imaging and LFP recordings. Red dots highlight location in V1 of pipette for injection of Picrotoxin (Ptx) and recordings of local field potential (LFP). Scale bar indicates 1 mm. h Frames from the eye camera taken when the pupil was constricted (top) or dilated (bottom), with fitted ellipses (red). i LFP traces measured during epileptiform activity, showing seizures (red triangles) and interictal events (blue triangles). j Simultaneous GCaMP fluorescence, averaged over the imaging window (discontinuities indicate pauses in image acquisition). k,l Behavioral measures during epileptiform discharges: pupil dilations (k) and running speed (l). Squares in k indicate times of example frames in h
Fig. 2
Fig. 2
Neural and behavioral signatures of seizures and interictal events. a Distribution of the duration of interictal events (blue) and seizures (red). Arrows indicate the medians of each distribution. b Distribution of event amplitudes, measured as the peak of the initial LFP negative event. c Distribution of inter-event intervals (time to next event). d LFP waveform following the onset of interictal events (blue) and seizures (red), averaged across all events in five mice. e Change in pupil radius triggered on the onset of interictal events (blue) and seizures (red), for one representative animal. Arrow indicates event onset. f Same, for running speed. g Time courses of GCaMP activity in the same animal, averaged over area V1, during interictal events (blue) and seizures (red). Green trace shows response to visual stimuli for comparison. h LFP waveform of representative interictal events in one experiment. Blue trace highlights a single event. i Same as h, for seizures in the same experiment, with a highlighted trace in red. j, k GCaMP activity averaged over visual cortex during the example events in h
Fig. 3
Fig. 3
Interictal events and seizures start as standing waves, and seizures subsequently propagate widely across cortex. a Frames obtained through GCaMP imaging in a representative interictal event (the one with LFP in Fig. 2h and j). The cartoon electrode indicates the site of Ptx injection and epileptic focus. b Retinotopic map and map of maximal activation in response to visual stimulation for this animal. Scale bar is 1 mm. c Same as a, for a representative seizure (the one highlighted in Fig. 2i and k). Labels indicate the time of each frame from event onset and apply to frames in a and c. d Predictions of a standing wave model fit to interictal event in a. e The standing wave is the product of a single temporal waveform (Time course) and a fixed spatial profile (Map). The map and the time course shown are averaged across interictal events for this animal. f The residuals of the fit in e are small, indicating little deviation of interictal event from standing wave. g The root-mean-square residuals for the standing wave model applied to interictal events (blue) and seizures (red). The spatial map was optimized to fit interictal events. Shaded areas indicate two s.e.m. h Variance explained by the standing wave model for interictal events (blue dot) and 1 s intervals of seizures (red dots). Error bars show median ± 1 quartile. Shaded blue area indicates the 96% confidence interval for quality of the fit to interictal events. i Predictions of the standing wave model for the seizure in c. The model was constrained to have the same spatial map as interictal events, and was free to have the best-fitting time course. j Residuals between seizure and standing wave model are small in the first ~0.3 s after onset, but subsequently become prominent, when the standing wave model fails to capture the propagation typical of seizures
Fig. 4
Fig. 4
Interictal events and early seizures engage both contiguous spread and homotopic connectivity. a Average spatial profile of interictal events measured in one mouse, obtained by averaging the maximum projection map across events (n = 242). The cartoon electrode indicates the site of Ptx injection and LFP recording. Scale bar is 1 mm. b Map of retinotopy (preferred horizontal position) with a line from the focus in V1 to area LM, joining regions of interest (ROIs) with same preferred vertical position as the focus in V1. c Peak ΔF/F0 response at each ROI in b for a representative interictal event (black) and for 30 other interictal events (gray). d The spatial profile averaged across interictal events for three representative animals (two measured with GCaMP3 and the third with GCaMP6), along lines drawn with the same strategy as in b. Dot color indicates the retinotopic preference of the corresponding location. Insets show the magnified profile of responses in area LM. The very thin gray shaded line represents mean ± s.e.m. eh The bimodal profile of activity for each interictal event is well described by the dot product of a function of cortical distance from the focus e, and a function of retinotopic distance from the focus h. Dotted lines illustrate how the model predicts the second peak of activation ~2 mm away from the focus f, due to the similar retinotopic preference of that region and the focus g. i Distribution of fit parameters for the example animal, indicating a consistent role of contiguous spread and homotopic connectivity across events
Fig. 5
Fig. 5
Seizure propagation recruits homotopic regions of cortex. a Frames imaged in a representative seizure. Labels indicate time from seizure onset, and cartoon electrode indicates the site of Ptx injection and LFP recording. b Maximum extent of seizure invasion averaged across 14 seizures in this mouse. c Single-trial time course along the ROIs in Fig. 4b, for the seizure in a. Dots mark the representative times in a and d. Arrowheads mark the focus in V1 and homotopic region in LM. d Spatial profile of the seizure in c, at representative times, normalized to their maximum. e Seizure invasion delay averaged across seizures. Shaded area represents s.e.m. f Same, averaged across four animals. Error bars indicate two s.e.m. Line: linear fit, with shaded 95% confidence interval. g The residuals of the linear fit in f reveal a clear dependence on retinotopic distance from the focus. Line: linear fit, with shaded 95% confidence interval. h Map of delay to seizure invasion, averaged across 14 seizures in one mouse. i Prediction of that map based solely on cortical distance from the focus. j Residuals of that prediction. Scale bars are 1 mm
Fig. 6
Fig. 6
Homotopic propagation of 6–11 Hz oscillations during seizures. a LFP recording of the seizure in Fig. 5a, bandpass filtered between 6 and 11 Hz. Highlighted in black is an epoch of coherent oscillations driven by the focus, used for the analysis in the next panels. b Cycle average of the 6–11 Hz oscillation from the unfiltered LFP trace. Gray traces show the individual cycles of the oscillation. c, d Same as a, b, for the GCaMP fluorescence measured at the focus. Oscillation highlighted in red. e Retinotopic maps for an example animal. The cartoon electrode indicates the site of Ptx injection and LFP recording, the dashed line represents visual areas contours. f Oscillatory delay for three example seizures from this example animal. Delay was obtained from the 6–11 Hz Hilbert phase referenced at the focus, averaged across all cycles of the oscillation for a given seizure. g Average LFP cycle (top) and average GCaMP fluorescence (bottom), averaged across all the seizures for this animal. Shaded area represents the standard deviation. hm Same as eg for six other seizures in two other mice. In all seizures and all mice, the delay of the oscillation faithfully recapitulates the retinotopic maps. Scale bar: 1 mm

Comment in

References

    1. Wiebe S, Jette N. Pharmacoresistance and the role of surgery in difficult to treat epilepsy. Nat. Rev. Neurol. 2012;8:669–677. doi: 10.1038/nrneurol.2012.181. - DOI - PubMed
    1. Motelow JE, et al. Decreased subcortical cholinergic arousal in focal seizures. Neuron. 2015;85:561–572. doi: 10.1016/j.neuron.2014.12.058. - DOI - PMC - PubMed
    1. Schwartz TH, Bonhoeffer T. In vivo optical mapping of epileptic foci and surround inhibition in ferret cerebral cortex. Nat. Med. 2001;7:1063–1067. doi: 10.1038/nm0901-1063. - DOI - PubMed
    1. Carmignoto G, Haydon PG. Astrocyte calcium signaling and epilepsy. Glia. 2012;60:1227–1233. doi: 10.1002/glia.22318. - DOI - PMC - PubMed
    1. Qiu C, Shivacharan RS, Zhang M, Durand DM. Can neural activity propagate by endogenous electrical field? J. Neurosci. 2015;35:15800–15811. doi: 10.1523/JNEUROSCI.1045-15.2015. - DOI - PMC - PubMed

Publication types