. 2017 Aug 9;8(1):236.
doi: 10.1038/s41467-017-00141-2.

Annotating pathogenic non-coding variants in genic regions

Affiliations

Annotating pathogenic non-coding variants in genic regions

Sahar Gelfman et al. Nat Commun. .

Abstract

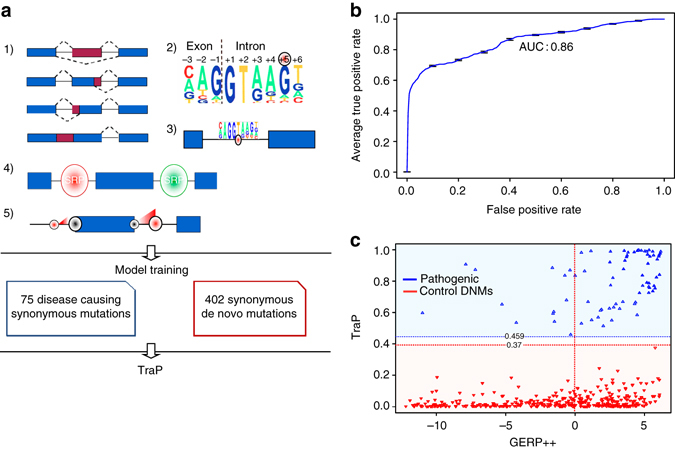
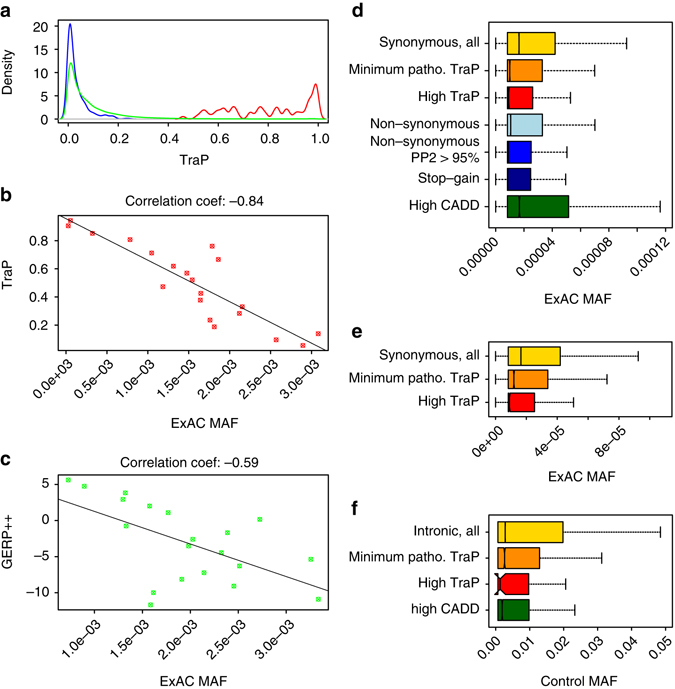
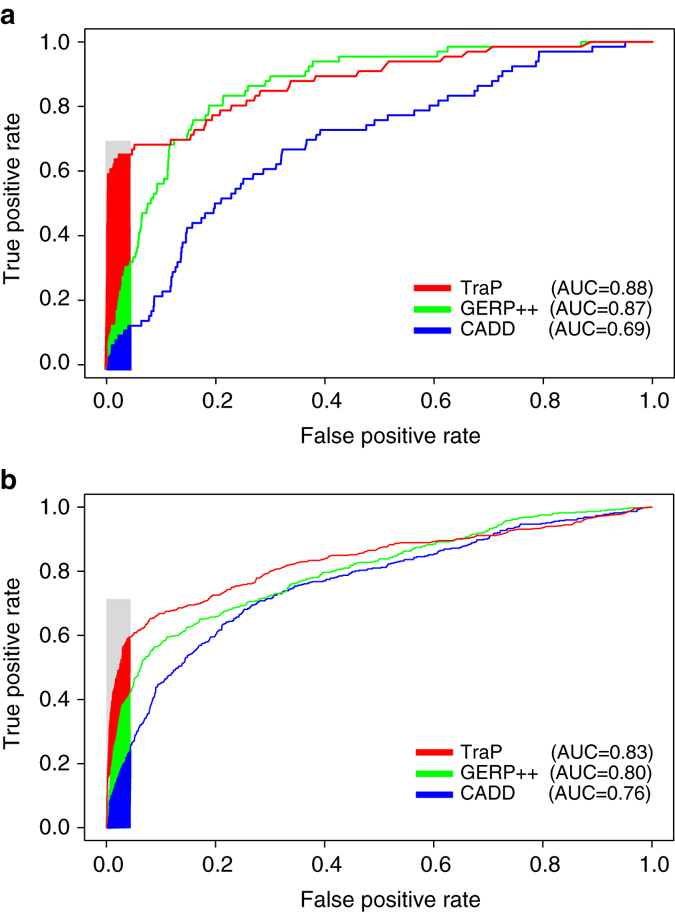
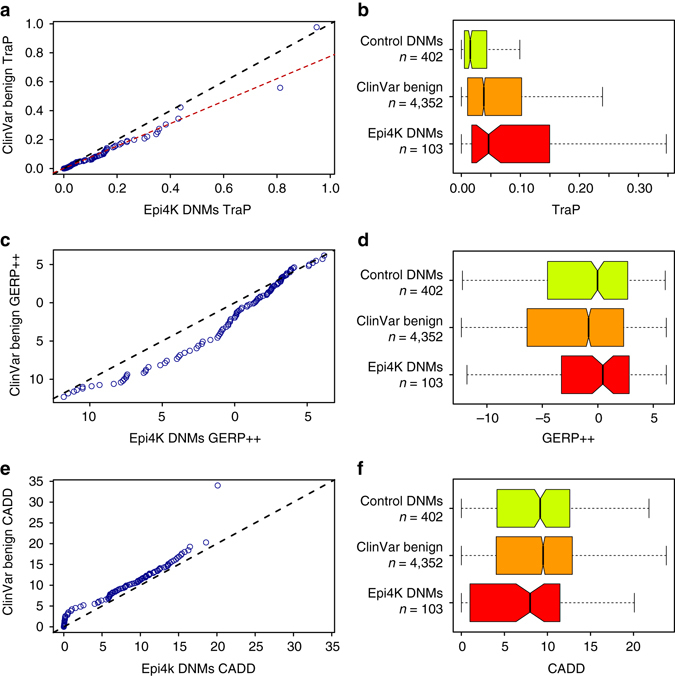
Identifying the underlying causes of disease requires accurate interpretation of genetic variants. Current methods ineffectively capture pathogenic non-coding variants in genic regions, resulting in overlooking synonymous and intronic variants when searching for disease risk. Here we present the Transcript-inferred Pathogenicity (TraP) score, which uses sequence context alterations to reliably identify non-coding variation that causes disease. High TraP scores single out extremely rare variants with lower minor allele frequencies than missense variants. TraP accurately distinguishes known pathogenic and benign variants in synonymous (AUC = 0.88) and intronic (AUC = 0.83) public datasets, dismissing benign variants with exceptionally high specificity. TraP analysis of 843 exomes from epilepsy family trios identifies synonymous variants in known epilepsy genes, thus pinpointing risk factors of disease from non-coding sequence data. TraP outperforms leading methods in identifying non-coding variants that are pathogenic and is therefore a valuable tool for use in gene discovery and the interpretation of personal genomes.While non-coding synonymous and intronic variants are often not under strong selective constraint, they can be pathogenic through affecting splicing or transcription. Here, the authors develop a score that uses sequence context alterations to predict pathogenicity of synonymous and non-coding genetic variants, and provide a web server of pre-computed scores.


Conflict of interest statement

The authors declare no competing financial interests.

Figures

Fig. 1
Fig. 1
TraP model construction and evaluation. a TraP construction workflow and main features calculated for TraP: (1) Information acquisition from all genes and transcripts that harbor by the variant, (2) changes to splice site motif that affect it’s binding affinity to the splicing machinery, (3) creations of new splice junctions that might interact with the splicing machinery, (4) creations and disruptions of cis-acting binding sites to splicing regulatory proteins (SRP), (5) interactions between features, such as a stronger effect of a new splice site on an exon with a weak original splice site (red representing a new splice site). Model is trained using synonymous variants that are either known pathogenic variants (blue box, left) or DNMs from healthy individuals (red box, right). b A receiver-operating characteristic curve showing the results of 10 rounds of 10-fold cross-validations with an average AUC of 0.86. c Model predictions of the training-set show a clear separation of pathogenic variants (blue) versus control DNMs (red). TraP (y-axis) exhibits a minimum threshold for pathogenic variants of 0.459, below, which reside all control DNMs. GERP++ score (x-axis) considers 49.5% of benign variants as conserved
Fig. 2
Fig. 2
TraP and allele frequency of synonymous and intronic variants. a TraP density plots for training-set pathogenic variants (red), control DNMs (blue) and 1.46 M ExAC synonymous variants (green). b Correlation between TraP and MAF for 29,985 synonymous variants that create strong cryptic splice sites. The data set was binned into 20 groups by taking 5% score intervals and examining the correlation of the 20 points with the average MAF for each group. c Correlation between GERP++ score and MAF for 29,985 synonymous variants that create strong cryptic splice sites. The data set was binned 20 groups as in (b). d MAF distributions for different types of variants. MAF distribution for synonymous variants is presented with no Trap threshold (yellow), minimum pathogenic TraP (≥ 0.459, orange) and high TraP (≥ 0.93, red). Synonymous variants with high TraP (red), have significantly lower average MAF than NS variants (bright blue). MAF distribution of CADD top scoring synonymous variants (97.84th percentile) is also presented (green). e MAF distributions based on a non-GERP++TraP model for 1.46 M ExAC synonymous variants. Thresholds used differ from the final TraP model: minimum pathogenic TraP threshold used is the 25th percentile score (≥ 0.66, orange) and high TraP threshold is the 75th percentile score (≥ 0.955, red). f MAF distributions for 1.5 M intronic variants from 776 sequenced whole genomes. MAF distribution is presented for variants with no Trap threshold (yellow), minimum pathogenic TraP (≥ 0.459, orange) and high TraP (≥ 0.93, red). The whiskers of the boxplots extend to the most extreme data point, which is no more than 1.5 times the interquartile range away from the box
Fig. 3
Fig. 3
ROC curves of ClinVar pathogenic and benign variants. a A ROC curve of ClinVar pathogenic and benign synonymous variants, calculated for TraP (red), GERP++ (green) and CADD (blue). b Same as a but for ClinVar intronic variants. Colored area represents high specificity region
Fig. 4
Fig. 4
Epilepsy synonymous DNMs vs. ClinVar benign controls. A quantile–quantile plot for 103 Epi4K DNMs and 4,352 benign ClinVar synonymous variants is calculated for a TraP scores, c GERP++ scores and e CADD scores. Score distributions for training-set control DNMs, ClinVar benign variants and Epi4K DNMs are scored using b TraP, d GERP++ and f CADD.The whiskers of the boxplots extend to the most extreme data point, which is no more than 1.5 times the interquartile range away from the box
Fig. 5
Fig. 5
Mini-gene design and quantification. a Minigene design. (A) Exon 10 and flanking genomic sequence was amplified from patient and parent DNA and cloned into the pI-12 splicing reporter vector. (B) Predicted splicing effect if splice site mutation has no effect on WT splicing. (C) Predicted skipping of exon 10 if splice site is disrupted by K333. b Semi-quantitative PCR gel of splicing isoforms of parent harboring the W97C variant and proband harboring both the W97C and K333 variants

References

    1. Syrbe S, et al. De novo loss- or gain-of-function mutations in KCNA2 cause epileptic encephalopathy. Nat. Genet. 2015;47:393–9. doi: 10.1038/ng.3239. - DOI - PMC - PubMed
    1. Rovelet-Lecrux A, et al. De novo deleterious genetic variations target a biological network centered on Abeta peptide in early-onset Alzheimer disease. Mol. Psychiatry. 2015;20:1046–56. doi: 10.1038/mp.2015.100. - DOI - PubMed
    1. Zaidi S, et al. De novo mutations in histone-modifying genes in congenital heart disease. Nature. 2013;498:220–3. doi: 10.1038/nature12141. - DOI - PMC - PubMed
    1. Cirulli ET, et al. Exome sequencing in amyotrophic lateral sclerosis identifies risk genes and pathways. Science. 2015;347:1436–41. doi: 10.1126/science.aaa3650. - DOI - PMC - PubMed
    1. Steinberg KM, Yu B, Koboldt DC, Mardis ER, Pamphlett R. Exome sequencing of case-unaffected-parents trios reveals recessive and de novo genetic variants in sporadic ALS. Sci. Rep. 2015;5:9124. doi: 10.1038/srep09124. - DOI - PMC - PubMed

Publication types