. 2017 Aug 9;7(1):7661.
doi: 10.1038/s41598-017-08052-4.

Inhibition of Endoplasmic Reticulum Stress Preserves the Integrity of Blood-Spinal Cord Barrier in Diabetic Rats Subjected to Spinal Cord Injury

Affiliations

Inhibition of Endoplasmic Reticulum Stress Preserves the Integrity of Blood-Spinal Cord Barrier in Diabetic Rats Subjected to Spinal Cord Injury

Zili He et al. Sci Rep. .

Erratum in

Abstract

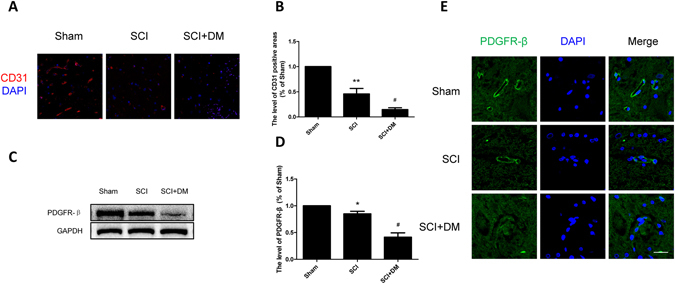
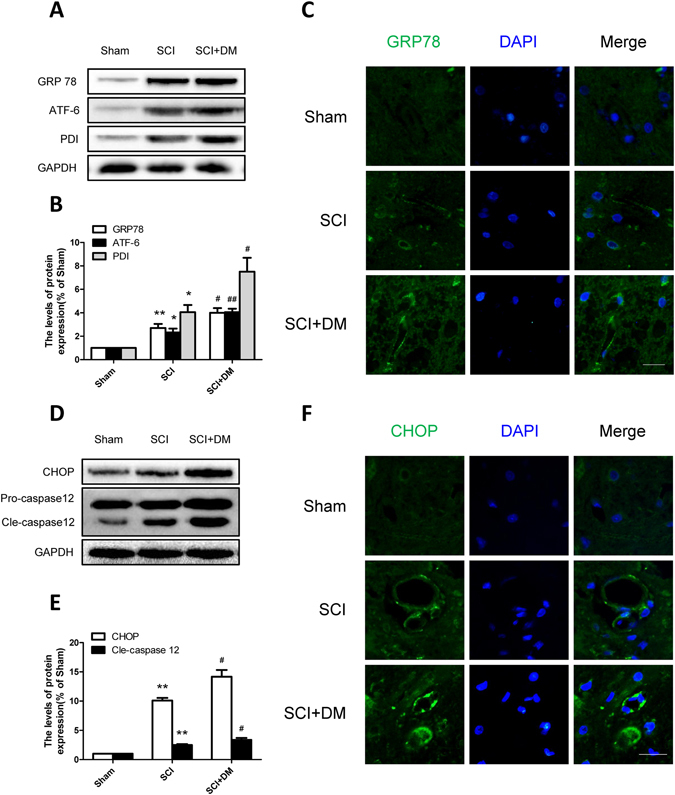
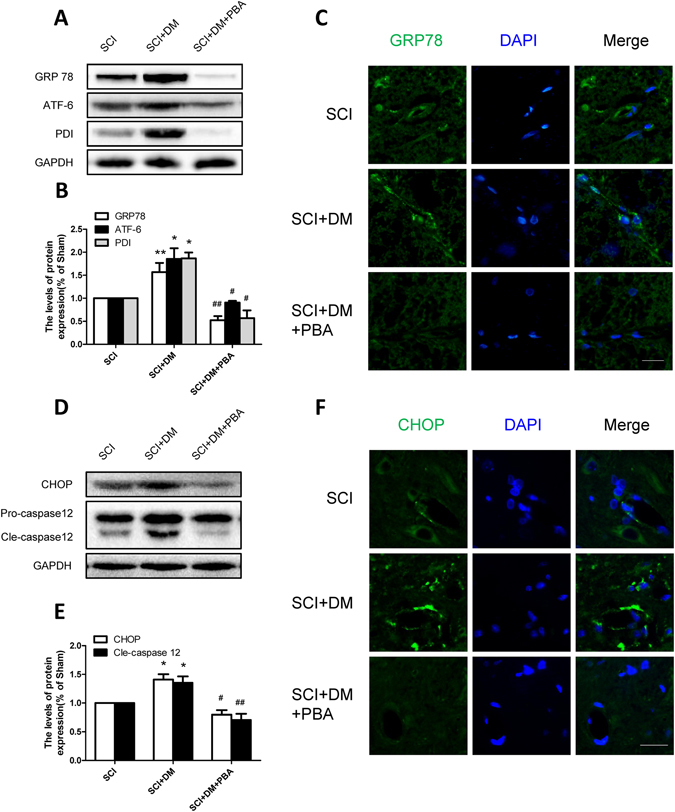
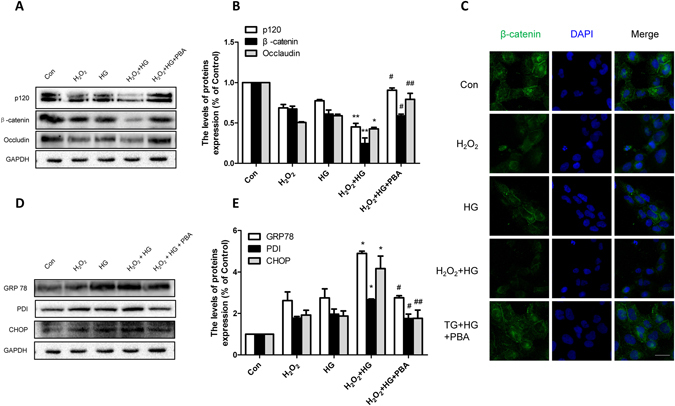
The blood-spinal cord barrier (BSCB) plays significance roles in recovery following spinal cord injury (SCI), and diabetes mellitus (DM) impairs endothelial cell function and integrity of BSCS. Endoplasmic reticulum (ER) stress occurs in the early stages of SCI and affects prognosis and cell survival. However, the relationship between ER stress and the integrity of BSCB in diabetic rats after SCI remains unclear. Here we observed that diabetic rats showed increased extravasation of Evans Blue (EB) dye, and loss of endothelial cells and pericytes 1 day after SCI compared to non-diabetic rats. Diabetes was also shown to induce activation of ER stress. Similar effects were observed in human brain microvascular endothelial cells. 4-phenylbutyric acid (4-PBA), an ER stress inhibitor lowered the adverse effect of diabetes on SCI, reduced EB dye extravasation, and limited the loss of endothelial cells and pericytes. Moreover, 4-PBA treatment partially reversed the degradation of tight junction and adherens junction both in vivo and in vitro. In conclusion, diabetes exacerbates the disruption of BSCB after SCI via inducing ER stress, and inhibition of ER stress by 4-PBA may play a beneficial role on the integrity of BSCB in diabetic SCI rats, leading to improved prognosis.


Conflict of interest statement

The authors declare that they have no competing interests.

Figures

Figure 1
Figure 1
DM aggravates blood–spinal cord barrier (BSCB) permeability after SCI. After SCI, barrier permeability was measured 1d after injury, using Evans Blue (EB) dye in sham, SCI, and SCI + DM group. (A,B) Representative whole spinal cords and quantification of BSCB permeability data in each group showing EB dye permeabilized into the spinal cord, n = 4. (C,D) Representative confocal images of EB extravasation and quantification of the fluorescence intensity of EB in each group. Scale bar = 1 mm. n = 4, *p < 0.05, **p < 0.01 vs sham group, #p < 0.05, ##p < 0.01 vs SCI group.
Figure 2
Figure 2
DM aggravates microvessels loss and decreases pericyte coverage after SCI. (A,B) Immunofluorescence staining of CD31 and quantification of the level of CD31 positive areas in each group, n = 4. Scale bar = 50 μm. (C,D) Western blot and quantification of PDGFR-β in each group, n = 6. (E) Immunofluorescence staining of PDGFR-β in each group, n = 4. Scale bar = 10 μm. *p < 0.05, **p < 0.01 vs sham group, #p < 0.05 vs SCI group.
Figure 3
Figure 3
DM aggravates the loss of TJ and AJ proteins after SCI. (A,B) Western blot and quantification of p120 and β-catenin in each group, n = 6. (C) Immunofluorescence staining of p120 and CD31 in each group, n = 4. Scale bar = 10 μm. (D,E) Western blot and quantification of Occludin and Claudin-5 in each group, n = 6. (F) Immunofluorescence staining of Claudin-5 in each group, n = 4. Scale bar = 10 μm., *p < 0.05, **p < 0.01 vs sham group, #p < 0.05 vs SCI group.
Figure 4
Figure 4
DM exacerbates the activation of ER stress after SCI. (A,B) Western blot and quantification of GRP78, ATF-6 and PDI in each group, n = 6. (C) Immunofluorescence staining of GRP78 in each group, n = 4. Scale bar = 10 μm. (D,E) Western blot and quantification of CHOP and caspase12 in each group, n = 6. (G,H) Immunofluorescence staining of CHOP in each group, n = 4. Scale bar = 10 μm. *p < 0.05, **p < 0.01 vs sham group, #p < 0.05, ##p < 0.01 vs SCI group.
Figure 5
Figure 5
4-PBA preventes the excessive activation of ER stress in diabetic rats after SCI. (A,B) Western blot and quantification of GRP78, ATF-6 and PDI in each group, n = 6. (C) Immunofluorescence staining of GRP78 in each group, n = 4. Scale bar = 10 μm. (D,E) Western blot and quantification of CHOP and caspase12 in each group, n = 6. (F) Immunofluorescence staining of CHOP in each group, n = 4. Scale bar = 10 μm. *p < 0.05, **p < 0.01 vs SCI group, #p < 0.05, ##p < 0.01 vs SCI + DM group.
Figure 6
Figure 6
Inhibiting ER stress attenuates the adverse effects of diabetes in BSCB disruption after SCI. After SCI, barrier permeability was measured 1d after injury, using EB dye in SCI, SCI + DM and SCI + DM + PBA group. (A,B) Representative whole spinal cords and quantification of BSCB permeability data in each group showing EB dye permeabilized into the spinal cord, n = 4. (C,D) Representative confocal images of EB extravasation and quantification of the fluorescence intensity of EB in each group, n = 4. Scale bar = 1 mm. *p < 0.05, **p < 0.01 vs SCI group, ##p < 0.01 vs SCI + DM group.
Figure 7
Figure 7
Inhibiting ER stress preventes microvessels loss and increases pericyte coverage in diabetic rats after SCI. (A,B) Immunofluorescence staining of CD31 and quantification of the level of CD31 positive areas in each group, n = 4. Scale bar = 50 μm. (C,D) Western blot and quantification of PDGFR-β in each group, n = 6. (E) Immunofluorescence staining of PDGFR-β in each group, n = 4. Scale bar = 10 μm. *p < 0.05, **p < 0.01 vs SCI group, #p < 0.05, ##p < 0.01 vs SCI + DM group.
Figure 8
Figure 8
Inhibiting ER stress prevents the loss of TJ and AJ proteins in diabetic rats after SCI. (A,B) Western blot and quantification of p120 and β-catenin in each group, n = 6. (C) Immunofluorescence staining of p120 and CD31 in each group, n = 4. Scale bar = 10 μm. (D,E) Western blot and quantification of Occludin and Claudin-5 in each group, n = 6. (F) Immunofluorescence staining of Claudin-5 in each group, n = 4. Scale bar = 10 μm. *p < 0.05, **p < 0.01 vs SCI group, ##p < 0.01 vs SCI + DM group.
Figure 9
Figure 9
Inhibiting ER stress ameliorates H2O2 + HG induced loss of TJ and AJ proteins in vitro. (AD) Western blot and quantification of p120, β-catenin and Occludin in each group. (E) Immunofluorescence staining of β-catenin in each group. Scale bar = 10 μm. (E,F) Western blot and quantification of GRP78, PDI and CHOP in each group. *p < 0.05, **p < 0.01 vs H2O2 group, #p < 0.05, ##p < 0.01 vs H2O2 + HG group. All experiments were performed three times at least.

References

    1. Kaneko S, et al. A selective Sema3A inhibitor enhances regenerative responses and functional recovery of the injured spinal cord. Nature medicine. 2006;12:1380–1389. doi: 10.1038/nm1505. - DOI - PubMed
    1. Mikami Y, et al. A simple and reliable behavioral analysis of locomotor function after spinal cord injury in mice. Technical note. Journal of neurosurgery. 2002;97:142–147. - PubMed
    1. Abbott NJ, Patabendige AA, Dolman DE, Yusof SR, Begley DJ. Structure and function of the blood-brain barrier. Neurobiology of disease. 2010;37:13–25. doi: 10.1016/j.nbd.2009.07.030. - DOI - PubMed
    1. Stamatovic SM, Johnson AM, Keep RF, Andjelkovic AV. Junctional proteins of the blood-brain barrier: New insights into function and dysfunction. Tissue barriers. 2016;4:e1154641. doi: 10.1080/21688370.2016.1154641. - DOI - PMC - PubMed
    1. Lee JY, Kim HS, Choi HY, Oh TH, Yune TY. Fluoxetine inhibits matrix metalloprotease activation and prevents disruption of blood-spinal cord barrier after spinal cord injury. Brain: a journal of neurology. 2012;135:2375–2389. doi: 10.1093/brain/aws171. - DOI - PubMed

Publication types

MeSH terms