. 2017 Aug 9;7(1):7654.
doi: 10.1038/s41598-017-06837-1.

High-resolution transport-of-intensity quantitative phase microscopy with annular illumination

Affiliations

High-resolution transport-of-intensity quantitative phase microscopy with annular illumination

Chao Zuo et al. Sci Rep. .

Abstract

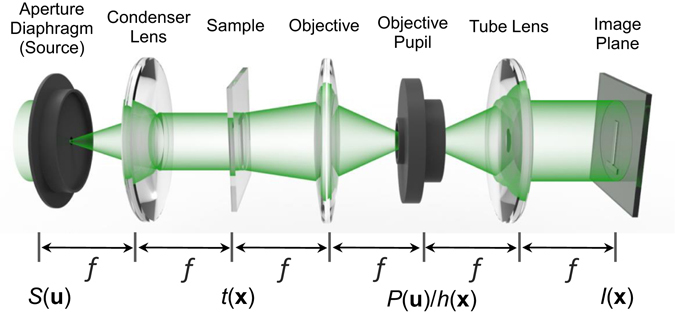
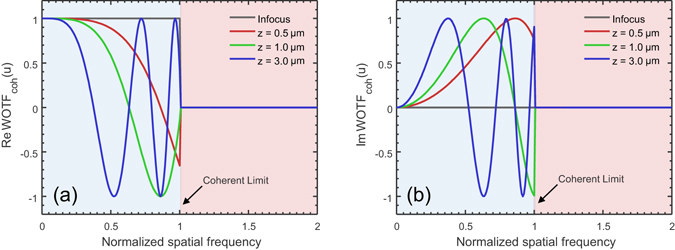
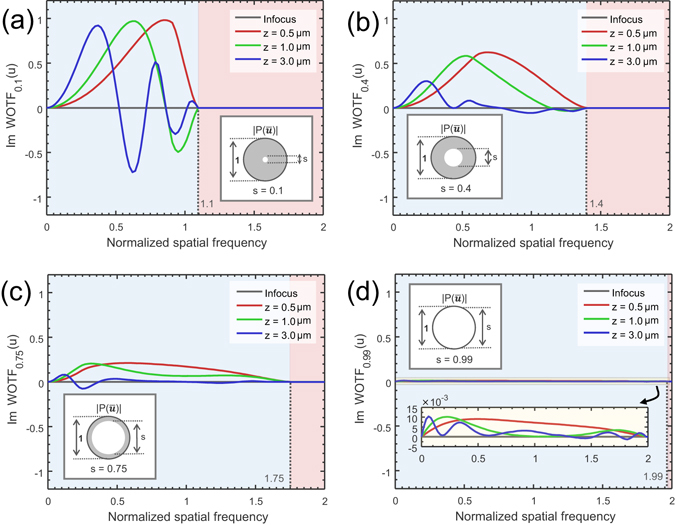
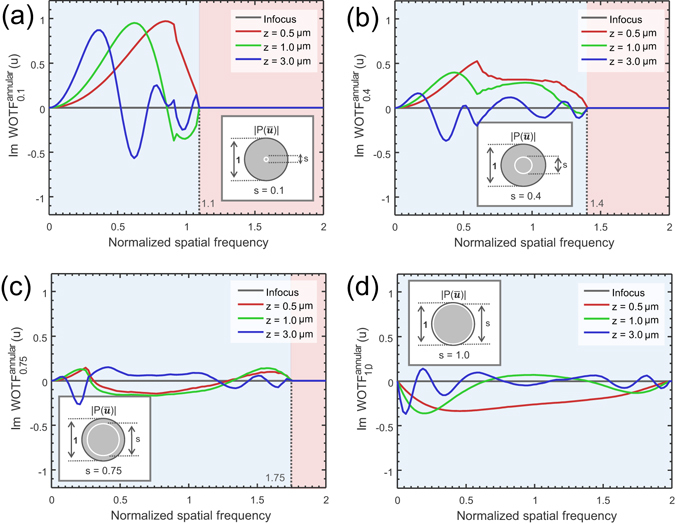
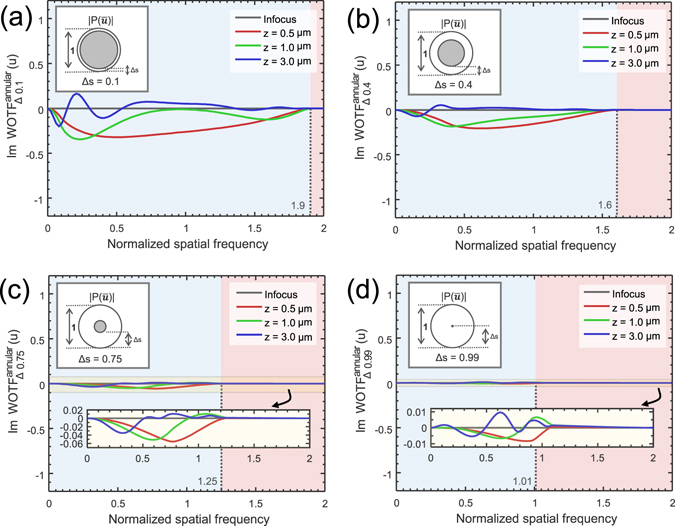
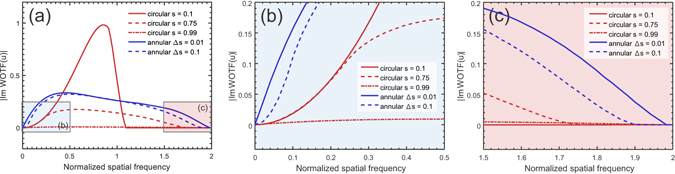
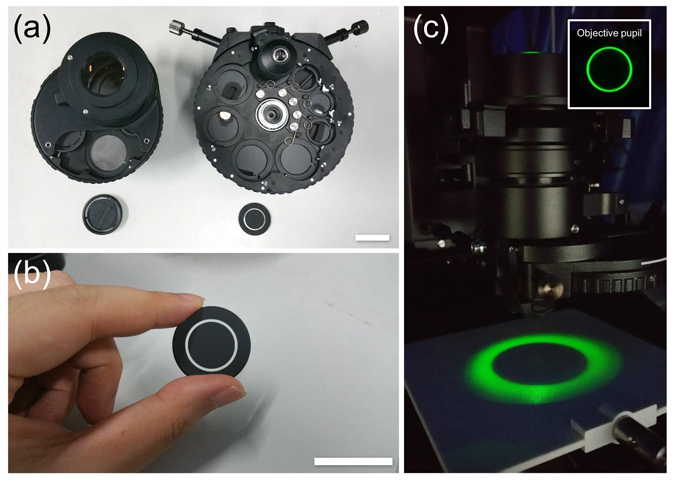
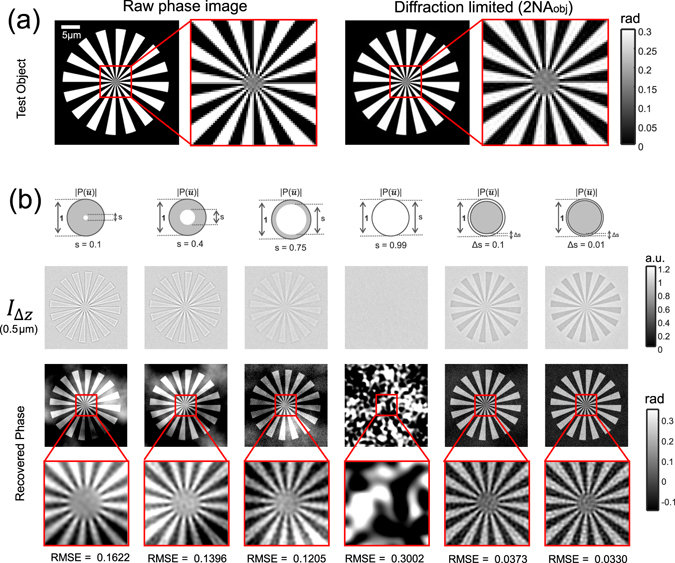
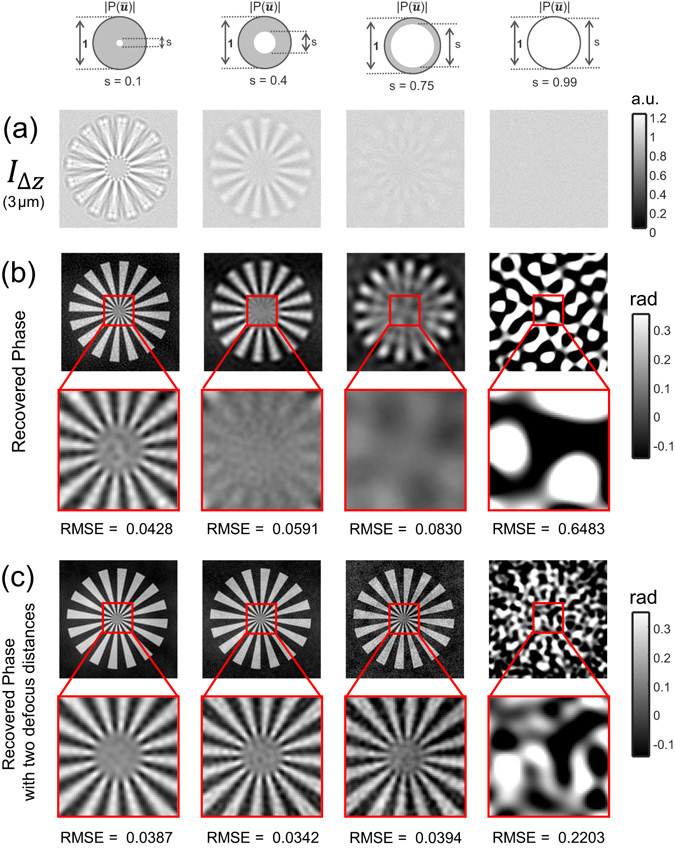
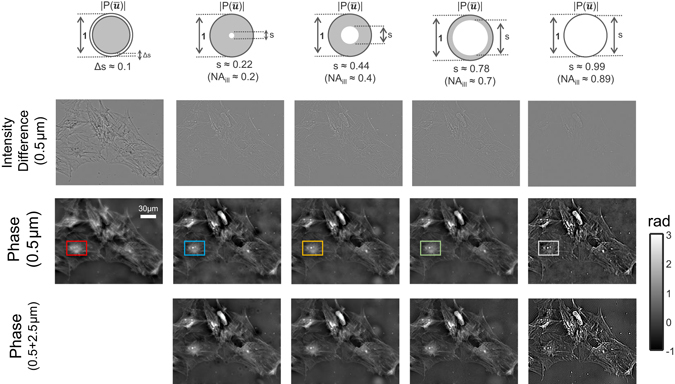
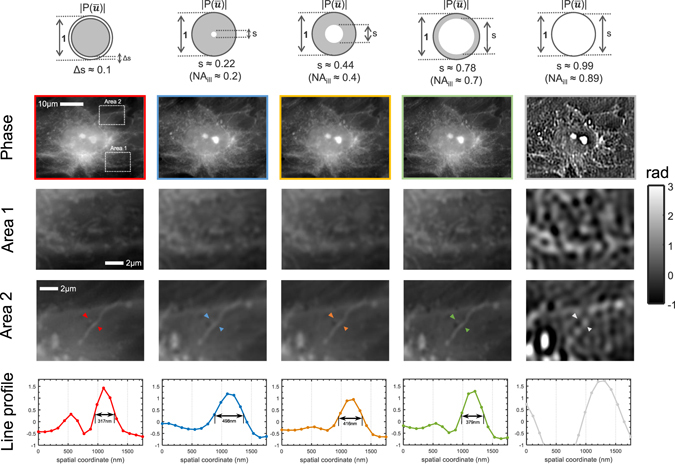
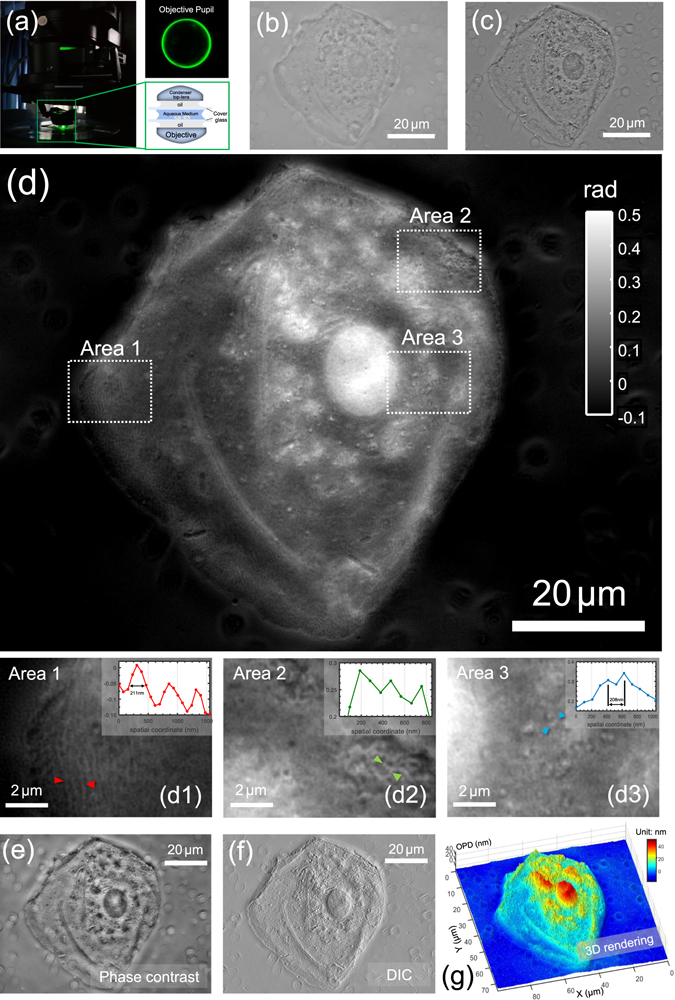
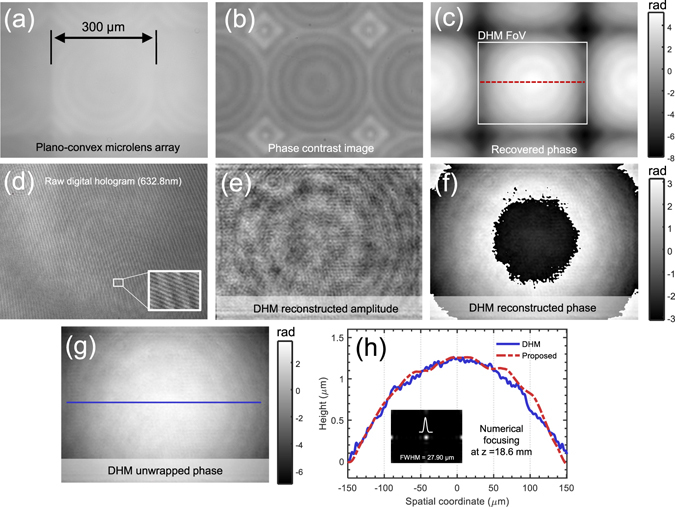
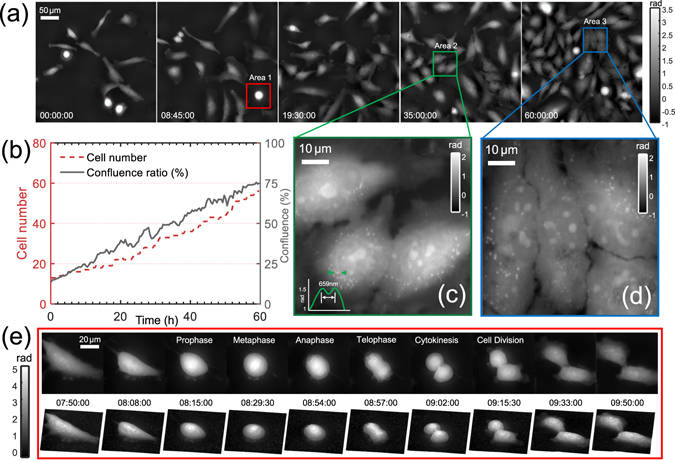
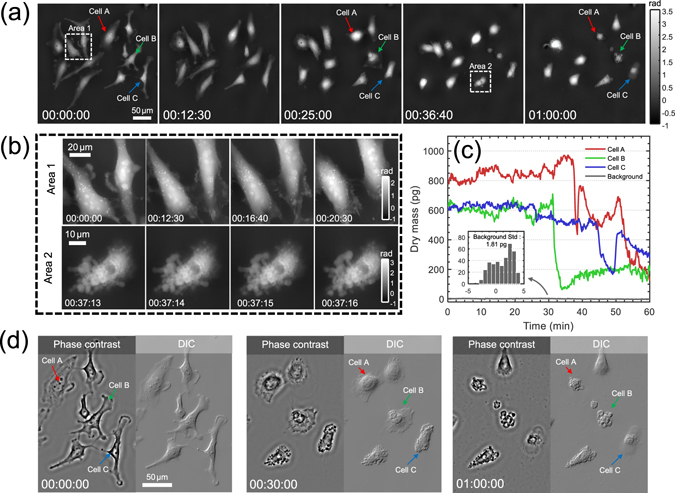
For quantitative phase imaging (QPI) based on transport-of-intensity equation (TIE), partially coherent illumination provides speckle-free imaging, compatibility with brightfield microscopy, and transverse resolution beyond coherent diffraction limit. Unfortunately, in a conventional microscope with circular illumination aperture, partial coherence tends to diminish the phase contrast, exacerbating the inherent noise-to-resolution tradeoff in TIE imaging, resulting in strong low-frequency artifacts and compromised imaging resolution. Here, we demonstrate how these issues can be effectively addressed by replacing the conventional circular illumination aperture with an annular one. The matched annular illumination not only strongly boosts the phase contrast for low spatial frequencies, but significantly improves the practical imaging resolution to near the incoherent diffraction limit. By incorporating high-numerical aperture (NA) illumination as well as high-NA objective, it is shown, for the first time, that TIE phase imaging can achieve a transverse resolution up to 208 nm, corresponding to an effective NA of 2.66. Time-lapse imaging of in vitro Hela cells revealing cellular morphology and subcellular dynamics during cells mitosis and apoptosis is exemplified. Given its capability for high-resolution QPI as well as the compatibility with widely available brightfield microscopy hardware, the proposed approach is expected to be adopted by the wider biology and medicine community.


Conflict of interest statement

The authors declare that they have no competing interests.

Figures

Figure 1
Figure 1
Description of image formation in a partially coherent microscope.
Figure 2
Figure 2
The WOTF coh for various defocus distances (NA obj = 0.8, λ = 550 nm, the spatial frequency coordinate is normalized against the coherent resolution limit NA obj/λ). (a) Real part of WOTF coh (amplitude CTF); (b) Imaginary part of WOTF coh (phase CTF).
Figure 3
Figure 3
The imaginary part of WOTF (phase WOTF) for various coherent parameters and defocus distances (NA obj = 0.8, λ = 550 nm, the spatial frequency coordinate is normalized against the coherent resolution limit NA obj/λ). (a) s = 0.1; (b) s = 0.4; (c) s = 0.75; (d) s = 0.99.
Figure 4
Figure 4
The imaginary part of WOTF (phase WOTF) when the source is a narrow annulus (NA obj = 0.8, λ = 550 nm, the spatial frequency coordinate is normalized against the coherent resolution limit NA obj/λ). (a) s = 0.1; (b) s = 0.4; (c) s = 0.75; (d) s = 1.0.
Figure 5
Figure 5
The imaginary part of WOTF (phase WOTF) when the thickness of the annulus varies (NA obj = 0.8, λ = 550 nm, the spatial frequency coordinate is normalized against the coherent resolution limit NA obj/λ). (a) Δs = 0.1; (b) Δs = 0.4; (c) Δs = 0.75; (d) Δs = 0.99.
Figure 6
Figure 6
(a) Magnitudes of the phase WOTFs of the annular illuminations (s = 0.01 and s = 0.1) and circular illuminations (s = 0.1, 0.75, 0.99) when the defocus distance is 0.5 μm. For clarity, the two blue- and red-boxed regions are further enlarged in (b) and (c), respective.
Figure 7
Figure 7
Photographs of two different condensers used in the experiments. (a) IX2-MLWCD (left) and U-UCD8-2 (right) condenser with the corresponding annuli. (b) Annulus for the U-UCD8-2 condenser. Scale bars in (a) and (b) are both 30 mm. (c) The annular illumination generated from the U-UCD8-2 condenser with a dry type top lens. The inset shows the corresponding rear focal plane image of the objective.
Figure 8
Figure 8
Comparison between annular illumination TIE and circular illumination TIE. (a) The raw Siemens star image and the corresponding best diffraction limited image can be achieved based on the simulation parameter. (b) Comparison of over-defocus images and reconstruction results of different illumination settings for a small defocus distance (Δz = 0.5 μm).
Figure 9
Figure 9
Comparison of over-defocus images (a) and reconstruction results of different illumination settings (b) for a large defocus distance (Δz = 3 μm). The synthesized phases using both small (Δz = 0.5 μm) and large defocus distances (Δz = 3 μm) are shown in (c).
Figure 10
Figure 10
Comparison of annular illumination TIE with circular illumination TIE for imaging of fixed human BMSC cells. First row: intensity difference from two defocused images with Δz = ±0.5 μm. Second row: phase reconstruction with of different illumination settings with single defocus distance (Δz = 0.5 μm). Second row: phase reconstruction with different illumination settings and single defocus distance. Third row: phase reconstruction with different illumination settings and two defocus distances (Δz = 0.5, 2.5 μm).
Figure 11
Figure 11
Comparison of imaging resolution between annular illumination TIE and circular illumination TIE for imaging of fixed human BMSC cells. Two areas (boxed regions) containing intracellular organelles near the nucleus are enlarged and shown in the second and third rows. The phase line profiles along the respective arrow are shown in the bottom row.
Figure 12
Figure 12
High-resolution imaging of buccal epithelial cell. (a) Optical configuration with the corresponding rear focal plane image of the objective. (b) In-focus intensity image. (c) Intensity difference image. (d) Reconstructed phase image. Three areas of interest (boxed regions) are enlarged in (d1–d3). The insets shows line profiles taken at different positions in the cell. (e) Simulated phase-contrast image; (f) Simulated DIC image; (g) Pseudo-color 3D rendering of the cell optical length.
Figure 13
Figure 13
Microlens array characterization using AI-TIE. (a) In-focus intensity image. (b) Phase contrast microscope image. (c) Reconstructed phase image by AI-TIE. (d) Digital hologram captured by a DHM system. The carrier fringes can be easily seen in the magnified area. (e) DHM reconstructed amplitude. (f) DHM reconstructed (wrapped) phase. (g) Unwrapped phase. (h) Height line profiles corresponding to the red dashed line in (c) and the blue solid line in (g), respectively.
Figure 14
Figure 14
Time-lapse phase imaging of HeLa cell division over a long period (60 h). (a) Representative quantitative phase images at different time points. (b) The change of cell number and confluence ratio over the culture passage period. (c) and (d) show the magnified views corresponding to two regions of interest (Area 2 and Area 3). (e) 10 selected time-lapse phase images and the corresponding 3D renderings showing the morphological features of a dividing cell (Area 1) at different stages of mitosis.
Figure 15
Figure 15
Multi-modal computational imaging of apoptotic HeLa cells induced by paclitaxel. The phase is reconstructed every second from the beginning of the drug treatment. (a) 5 representative quantitative phase images spanning over 1 h. (b) Magnified views at different time points corresponding to regions of interest (Areas 1 and 2). (c) Dry mass changes of three labeled cells during apoptosis. (d) Simulated phase contrast and DIC images at three time points.

References

    1. Betzig E, et al. Imaging intracellular fluorescent proteins at nanometer resolution. Science. 2006;313:1642–1645. doi: 10.1126/science.1127344. - DOI - PubMed
    1. Hell SW, Wichmann J. Breaking the diffraction resolution limit by stimulated emission: stimulated-emission-depletion fluorescence microscopy. Opt. Lett. 1994;19:780–782. doi: 10.1364/OL.19.000780. - DOI - PubMed
    1. Gustafsson MG. Surpassing the lateral resolution limit by a factor of two using structured illumination microscopy. J. Microsc. 2000;198:82–87. doi: 10.1046/j.1365-2818.2000.00710.x. - DOI - PubMed
    1. Stephens DJ, Allan VJ. Light microscopy techniques for live cell imaging. Science. 2003;300:82–86. doi: 10.1126/science.1082160. - DOI - PubMed
    1. Barty A, Nugent K, Paganin D, Roberts A. Quantitative optical phase microscopy. Optics Letters. 1998;23:817–819. doi: 10.1364/OL.23.000817. - DOI - PubMed

Publication types