. 2017 Jul 26:12:5313-5330.
doi: 10.2147/IJN.S136032. eCollection 2017.

Paclitaxel-loaded and A10-3.2 aptamer-targeted poly(lactide- co-glycolic acid) nanobubbles for ultrasound imaging and therapy of prostate cancer

Affiliations

Paclitaxel-loaded and A10-3.2 aptamer-targeted poly(lactide- co-glycolic acid) nanobubbles for ultrasound imaging and therapy of prostate cancer

Meng Wu et al. Int J Nanomedicine. .

Abstract

In the current study, we synthesized prostate cancer-targeting poly(lactide-co-glycolic acid) (PLGA) nanobubbles (NBs) modified using A10-3.2 aptamers targeted to prostate-specific membrane antigen (PSMA) and encapsulated paclitaxel (PTX). We also investigated their impact on ultrasound (US) imaging and therapy of prostate cancer. PTX-A10-3.2-PLGA NBs were developed using water-in-oil-in-water (water/oil/water) double emulsion and carbodiimide chemistry approaches. Fluorescence imaging together with flow cytometry verified that the PTX-A10-3.2-PLGA NBs were successfully fabricated and could specifically bond to PSMA-positive LNCaP cells. We speculated that, in vivo, the PTX-A10-3.2-PLGA NBs would travel for a long time, efficiently aim at prostate cancer cells, and sustainably release the loaded PTX due to the improved permeability together with the retention impact and US-triggered drug delivery. The results demonstrated that the combination of PTX-A10-3.2-PLGA NBs with low-frequency US achieved high drug release, a low 50% inhibition concentration, and significant cell apoptosis in vitro. For mouse prostate tumor xenografts, the use of PTX-A10-3.2-PLGA NBs along with low-frequency US achieved the highest tumor inhibition rate, prolonging the survival of tumor-bearing nude mice without obvious systemic toxicity. Moreover, LNCaP xenografts in mice were utilized to observe modifications in the parameters of PTX-A10-3.2-PLGA and PTX-PLGA NBs in the contrast mode and the allocation of fluorescence-labeled PTX-A10-3.2-PLGA and PTX-PLGA NBs in live small animals and laser confocal scanning microscopy fluorescence imaging. These results demonstrated that PTX-A10-3.2-PLGA NBs showed high gray-scale intensity and aggregation ability and showed a notable signal intensity in contrast mode as well as aggregation ability in fluorescence imaging. In conclusion, we successfully developed an A10-3.2 aptamer and loaded PTX-PLGA multifunctional theranostic agent for the purpose of obtaining US images of prostate cancer and providing low-frequency US-triggered therapy of prostate cancer that was likely to constitute a strategy for both prostate cancer imaging and chemotherapy.

Keywords: aptamer; cancer therapy; nanobubbles; paclitaxel; prostate-specific membrane antigen; ultrasound imaging.


Conflict of interest statement

Disclosure The authors report no conflicts of interest in this work.

Figures

Figure 1
Figure 1
Detection of binding between NBs and A10-3.2 aptamer using LCSM and FCM. Notes: (A) DiI-labeled NBs showing red fluorescence. (B) FAM-labeled A10-3.2 aptamer showing green fluorescence. (C) Overlap of the A10-3.2 aptamer with NBs appearing as yellow fluorescence in the combined channel. (D) PTX-PLGA NBs. (E) PTX-A10-3.2-PLGA NBs. (F) Average binding efficiencies of different NBs. Abbreviations: DiI, 1,1′-dioctadecyl-3,3,3′,3′-tetramethylindocarbocyanine perchlorate; FAM, carboxyfluorescein; FCM, flow cytometry; LCSM, laser confocal scanning microscopy; NBs, nanobubbles; PLGA, poly(lactide-co-glycolic acid); PTX, paclitaxel.
Figure 2
Figure 2
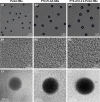
Characterization of NBs. Notes: (A1A3) Optical microscopy images of different formulations of NBs. (B1B3) SEM (×20,000) images of different formulations of NBs. (C1C3) TEM images of different formulations of NBs. Abbreviations: NBs, nanobubbles; PLGA, poly(lactide-co-glycolic acid); PTX, paclitaxel; SEM, scanning electron microscopy; TEM, transmission electron microscopy.
Figure 3
Figure 3
In vitro drug release profiles. Notes: (A) In vitro drug release profiles of PTX-A10-3.2-PLGA NBs and PTX-A10-3.2-PLGA NBs + US for 1–30 days. (B) In vitro drug release profiles of PTX-A10-3.2-PLGA NBs and PTX-A10-3.2-PLGA NBs + US for 1–5 days. Abbreviations: NBs, nanobubbles; PLGA, poly(lactide-co-glycolic acid); PTX, paclitaxel; US, ultrasound.
Figure 4
Figure 4
Detection of binding between different formulations of NBs and two types of cells using direct fluorescence imaging and FCM. Notes: (A) PTX-A10-3.2-PLGA NBs + US and LNCaP cells. (B) PTX-A10-3.2-PLGA NBs and LNCaP cells. (C) PTX-A10-3.2-PLGA NBs + A10-3.2 and LNCaP cells. (D) PTX-PLGA NBs and LNCaP cells. (E) PTX-A10-3.2-PLGA NBs and PC3 cells. (F) Histogram of the binding efficiency between different formulations of NBs and the two types of cells. Blue (DAPI) indicates cell nuclei, green (DiO) indicates the cytomembrane, and red (DiI) dots indicate DiI-labeled NBs. Abbreviations: DAPI, 4′,6-diamidino-2-phenylindole; DiI, 1,1′-dioctadecyl-3,3,3′,3′-tetramethylindocarbocyanine perchlorate; DiO, 3,3′-dioctadecyloxacarbocyanine perchlorate; FCM, flow cytometry; NBs, nanobubbles; PLGA, poly(lactide-co-glycolic acid); PTX, paclitaxel; US, ultrasound.
Figure 5
Figure 5
In vitro cell viability. Notes: (A) Effect of different formulations of NBs on the viability of LNCaP cells for 48 h. PTX-A10-3.2-PLGA NBs compared with the other three groups, #P<0.05, ##P<0.01; PTX-PLGA NBs compared with the other three groups, **P<0.01. (B) Effect of different PTX-loaded formulations on the viability of LNCaP cells for 48 h. PTX-A10-3.2-PLGA NBs + US compared with the other three groups, #P<0.05, ##P<0.01; PTX compared with the other three groups, **P<0.01; PTX-PLGA NBs compared with PTX-A10-3.2-PLGA NBs, P<0.05, ▲▲P<0.01. (C) Cell viability of LNCaP cells incubated with PTX-A10-3.2-PLGA NBs at different concentrations of PTX with or without ultrasonic irradiation for 48 h. PC3 cells were used as controls. PTX-A10-3.2-PLGA NBs + US + LNCaP cells compared with the other three groups, #P<0.05, ##P<0.01; PTX-A10-3.2-PLGA NBs + PC3 cells compared with the other three groups, **P<0.01; PTX-A10-3.2-PLGA NBs + LNCaP cells compared with PTX-A10-3.2-PLGA NBs + US + PC3 cells groups, ▲▲P<0.01. Abbreviations: NBs, nanobubbles; PLGA, poly(lactide-co-glycolic acid); PTX, paclitaxel; US, ultrasound.
Figure 6
Figure 6
Cell apoptosis is detected by FCM in various groups. Notes: (A and C) 24 h; (B and D) 48 h: control, PTX, PTX-PLGA NBs, PTX-A10-3.2-PLGA NBs and PTX-A10-3.2-PLGA NBs + US. Data are mean ± SD (n=3). Control compared with other groups, *P<0.05, **P<0.01; PTX-A10-3.2-PLGA NBs + US compared with other groups, #P<0.05, ##P<0.01; PTX-PLGA NBs compared with PTX and PTX-A10-3.2-PLGA NBs, P<0.05, ▲▲P<0.01; PTX compared with PTX-A10-3.2-PLGA NBs, P<0.05, □□P<0.01. Abbreviations: EA, early apoptosis; FCM, flow cytometry; LA, late apoptosis; NBs, nanobubbles; PLGA, poly(lactide-co-glycolic acid); PTX, paclitaxel; TA, total apoptosis; US, ultrasound.
Figure 7
Figure 7
NBs in US imaging in vitro. Notes: (A) Samples with different concentrations of PTX-A10-3.2-PLGA NBs (2.5, 5, 10, 20, and 40 mg/mL), Brightness mode and contrast mode. (B) Relationship between the mean gray value and the concentration. The deionized water group compared with other groups, *P<0.05; PTX-A10-3.2-PLGA NBs (40 mg/mL) group compared with the other groups, #P<0.05. Abbreviations: NBs, nanobubbles; PLGA, poly(lactide-co-glycolic acid); PTX, paclitaxel; US, ultrasound.
Figure 8
Figure 8
High-frequency resolution US imaging under contrast mode for PTX-PLGA NBs and PTX-A10-3.2-PLGA NBs in xenograft tumors. Notes: (A) Tumor-targeted real-time US imaging in contrast mode (the enhancement is shown in green) in various groups: the normal saline group, PTX-PLGA NBs group, and PTX-A10-3.2-PLGA NBs group. (B) GSI in various groups. Control compared with the other groups, *P<0.05; PTX-A10-3.2-PLGA NBs compared with the other groups, #P<0.05. Abbreviations: GSI, gray-scale intensity; NBs, nanobubbles; PLGA, poly(lactide-co-glycolic acid); PTX, paclitaxel; US, ultrasound.
Figure 9
Figure 9
Changes in the fluorescence intensity of DiR-labeled PTX-PLGA NBs and PTX-A10-3.2-PLGA NBs in xenograft tumors at the time intervals of 0, 2, 4, 8, 12, and 24 h. Note: Red circles indicate the areas of xenograft tumors. Abbreviations: DiR, 1,1′-dioctadecyl-3,3,3′,3′-tetramethylindotricarbocyanine; NBs, nanobubbles; PLGA, poly(lactide-co-glycolic acid); PTX, paclitaxel.
Figure 10
Figure 10
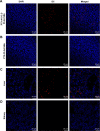
Distribution of different formulations of DiI-labeled NBs in the cryosections of different organ tissues by LCSM and IOD in the different organ tissues. Notes: (AE) Distribution of different formulations of DiI-labeled NBs in the tumor, liver, spleen, and kidney. (F) IOD in the tumor, liver, spleen, and kidney. PTX-PLGA NBs compared with PTX-A10-3.2-PLGA NBs, ***P<0.001. Blue indicates cell nuclei; red dots indicate DiI-labeled NBs. Abbreviations: DAPI, 4′,6-diamidino-2-phenylindole; DiI, 1,1′-dioctadecyl-3,3,3′,3′-tetramethylindocarbocyanine perchlorate; IOD, integrated optical density; LCSM, laser confocal scanning microscopy; NBs, nanobubbles; PLGA, poly(lactide-co-glycolic acid); PTX, paclitaxel.
Figure 10
Figure 10
Distribution of different formulations of DiI-labeled NBs in the cryosections of different organ tissues by LCSM and IOD in the different organ tissues. Notes: (AE) Distribution of different formulations of DiI-labeled NBs in the tumor, liver, spleen, and kidney. (F) IOD in the tumor, liver, spleen, and kidney. PTX-PLGA NBs compared with PTX-A10-3.2-PLGA NBs, ***P<0.001. Blue indicates cell nuclei; red dots indicate DiI-labeled NBs. Abbreviations: DAPI, 4′,6-diamidino-2-phenylindole; DiI, 1,1′-dioctadecyl-3,3,3′,3′-tetramethylindocarbocyanine perchlorate; IOD, integrated optical density; LCSM, laser confocal scanning microscopy; NBs, nanobubbles; PLGA, poly(lactide-co-glycolic acid); PTX, paclitaxel.
Figure 11
Figure 11
Therapeutic effects in various treatment groups in vivo. Notes: (A) Tumor volume growth curves in various treatment groups. The red arrow indicates the start of treatment, and the black arrow indicates the end of treatment. (B) Tumor volumes in various treatment groups. (C) TIR in various groups. The saline control group compared with the other groups, **P<0.01; PTX-A10-3.2-PLGA NBs + US compared with the other groups, ##P<0.01; PTX compared with the other groups, ▲▲P<0.01; PTX-PLGA NBs compared with the PTX-A10-3.2-PLGA NBs group, □□P<0.01. Abbreviations: NBs, nanobubbles; PLGA, poly(lactide-co-glycolic acid); PTX, paclitaxel; TIR, tumor inhibition rate; US, ultrasound.
Figure 11
Figure 11
Therapeutic effects in various treatment groups in vivo. Notes: (A) Tumor volume growth curves in various treatment groups. The red arrow indicates the start of treatment, and the black arrow indicates the end of treatment. (B) Tumor volumes in various treatment groups. (C) TIR in various groups. The saline control group compared with the other groups, **P<0.01; PTX-A10-3.2-PLGA NBs + US compared with the other groups, ##P<0.01; PTX compared with the other groups, ▲▲P<0.01; PTX-PLGA NBs compared with the PTX-A10-3.2-PLGA NBs group, □□P<0.01. Abbreviations: NBs, nanobubbles; PLGA, poly(lactide-co-glycolic acid); PTX, paclitaxel; TIR, tumor inhibition rate; US, ultrasound.
Figure 12
Figure 12
The analysis of survival curve and systemic toxicity in vivo. Notes: (A) Cumulative survival of tumor-bearing mice after receiving different formulations of PTX. (B) Changes in the body weight after treatment in various groups. Abbreviations: NBs, nanobubbles; PLGA, poly(lactide-co-glycolic acid); PTX, paclitaxel; US, ultrasound.

Similar articles

Cited by

References

    1. Sun Y, Zheng Y, Ran H, et al. Superparamagnetic PLGA-iron oxide microcapsules for dual-modality US/MR imaging and high intensity focused US breast cancer ablation. Biomaterials. 2012;33(24):5854–5864. - PubMed
    1. Chen T, Shukoor MI, Wang R, et al. Smart multifunctional nanostructure for targeted cancer chemotherapy and magnetic resonance imaging. ACS Nano. 2011;5(10):7866–7873. - PMC - PubMed
    1. Koo OM, Rubinstein I, Onyuksel H. Role of nanotechnology in targeted drug delivery and imaging: a concise review. Nanomedicine. 2005;1(3):193–212. - PubMed
    1. Aravind A, Nair R, Raveendran S, et al. Aptamer conjugated paclitaxel and magnetic fluid loaded fluorescently tagged PLGA nanoparticles for targeted cancer therapy. J Magn Magn Mater. 2013;344(344):116–123.
    1. Yang H, Deng L, Li T, et al. Multifunctional PLGA nanobubbles as theranostic agents: combining doxorubicin and P-gp siRNA co-delivery into human breast cancer cells and ultrasound cellular imaging. J Biomed Nanotechnol. 2015;11(12):2124–2136. - PubMed

MeSH terms