

Surface-enhanced Raman spectroscopy of serum accurately detects prostate cancer in patients with prostate-specific antigen levels of 4-10 ng/mL
- PMID: 28794631
- PMCID: PMC5538684
- DOI: 10.2147/IJN.S137756
Surface-enhanced Raman spectroscopy of serum accurately detects prostate cancer in patients with prostate-specific antigen levels of 4-10 ng/mL
Abstract
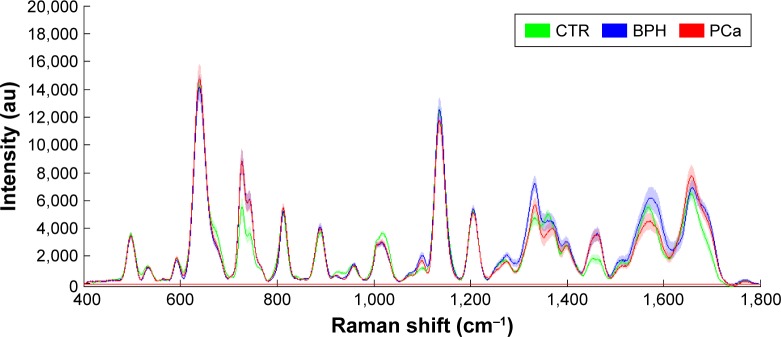
The surface-enhanced Raman spectroscopy (SERS) of blood serum was investigated to differentiate between prostate cancer (PCa) and benign prostatic hyperplasia (BPH) in males with a prostate-specific antigen level of 4-10 ng/mL, so as to reduce unnecessary biopsies. A total of 240 SERS spectra from blood serum were acquired from 40 PCa subjects and 40 BPH subjects who had all received prostate biopsies and were given a pathological diagnosis. Multivariate statistical techniques, including principal component analysis (PCA) and linear discriminant analysis (LDA) diagnostic algorithms, were used to analyze the spectra data of serum from patients in control (CTR), PCa and BPH groups; results offered a sensitivity of 97.5%, a specificity of 100.0%, a precision of 100.0% and an accuracy of 99.2% for CTR; a sensitivity of 90.0%, a specificity of 97.5%, a precision of 94.7% and an accuracy of 98.3% for BPH; a sensitivity of 95.0%, a specificity of 93.8%, a precision of 88.4% and an accuracy of 94.2% for PCa. Similarly, this technique can significantly differentiate low- and high-risk PCa with an accuracy of 92.3%, a specificity of 95% and a sensitivity of 89.5%. The results suggest that analyzing blood serum using SERS combined with PCA-LDA diagnostic algorithms is a promising clinical tool for PCa diagnosis and assessment.
Keywords: Ag nanoparticles; benign prostatic hyperplasia; gray zone; linear discriminant analysis; principle component analysis; spectral classification.
Conflict of interest statement
Disclosure The authors report no conflicts of interest in this work.
Figures


Similar articles
-
Classification analyses for prostate cancer, benign prostate hyperplasia and healthy subjects by SERS-based immunoassay of multiple tumour markers.Talanta. 2018 Oct 1;188:238-244. doi: 10.1016/j.talanta.2018.05.070. Epub 2018 May 23. Talanta. 2018. PMID: 30029370
-
Combining SERS analysis of serum with PSA levels for improving the detection of prostate cancer.Nanomedicine (Lond). 2018 Oct;13(19):2455-2467. doi: 10.2217/nnm-2018-0127. Epub 2018 Oct 4. Nanomedicine (Lond). 2018. PMID: 30284481
-
Surface-enhanced Raman spectroscopy of urine for prostate cancer detection: a preliminary study.Anal Bioanal Chem. 2015 May;407(12):3271-5. doi: 10.1007/s00216-015-8610-9. Epub 2015 Mar 20. Anal Bioanal Chem. 2015. PMID: 25791298
-
Surface-enhanced Raman scattering (SERS) spectroscopy for prostate cancer diagnosis: A review.Photodiagnosis Photodyn Ther. 2022 Mar;37:102690. doi: 10.1016/j.pdpdt.2021.102690. Epub 2021 Dec 16. Photodiagnosis Photodyn Ther. 2022. PMID: 34921990 Review.
-
Current advances and future visions on bioelectronic immunosensing for prostate-specific antigen.Biosens Bioelectron. 2017 Dec 15;98:267-284. doi: 10.1016/j.bios.2017.06.049. Epub 2017 Jun 27. Biosens Bioelectron. 2017. PMID: 28689113 Review.
Cited by
-
Highly accurate colorectal cancer prediction model based on Raman spectroscopy using patient serum.World J Gastrointest Oncol. 2020 Nov 15;12(11):1311-1324. doi: 10.4251/wjgo.v12.i11.1311. World J Gastrointest Oncol. 2020. PMID: 33250963 Free PMC article.
-
The Diagnostic Value of Plasma Small Extracellular Vesicle-Derived CAIX Protein in Prostate Cancer and Clinically Significant Prostate Cancer: A Study on Predictive Models.Prostate. 2025 Jun;85(8):723-741. doi: 10.1002/pros.24879. Epub 2025 Feb 27. Prostate. 2025. PMID: 40013658 Free PMC article.
-
Sensitive determination of dopamine levels via surface-enhanced Raman scattering of Ag nanoparticle dimers.Int J Nanomedicine. 2018 Apr 17;13:2337-2347. doi: 10.2147/IJN.S156932. eCollection 2018. Int J Nanomedicine. 2018. PMID: 29713165 Free PMC article.
-
Diagnostic Efficiency of Pan-Immune-Inflammation Value to Predict Prostate Cancer in Patients with Prostate-Specific Antigen between 4 and 20 ng/mL.J Clin Med. 2023 Jan 19;12(3):820. doi: 10.3390/jcm12030820. J Clin Med. 2023. PMID: 36769469 Free PMC article.
-
Label-Free Sensing with Metal Nanostructure-Based Surface-Enhanced Raman Spectroscopy for Cancer Diagnosis.ACS Appl Nano Mater. 2022 Sep 23;5(9):12276-12299. doi: 10.1021/acsanm.2c02392. Epub 2022 Aug 22. ACS Appl Nano Mater. 2022. PMID: 36210923 Free PMC article. Review.
References
-
- Torre LA, Bray F, Siegel RL, Ferlay J, Lortet-Tieulent J, Jemal A. Global cancer statistics, 2012. CA Cancer J Clin. 2015;65(2):87–108. - PubMed
-
- Siegel RL, Miller KD, Jemal A. Cancer statistics, 2016. CA Cancer J Clin. 2016;66(1):7–30. - PubMed
-
- Barry MJ. Clinical practice. Prostate-specific-antigen testing for early diagnosis of prostate cancer. N Engl J Med. 2011;344(18):1373–1377. - PubMed
MeSH terms
Substances
LinkOut - more resources
Full Text Sources
Other Literature Sources
Medical
Miscellaneous
