

Parallel Compression Is a Fast Low-Cost Assay for the High-Throughput Screening of Mechanosensory Cytoskeletal Proteins in Cells
- PMID: 28795554
- PMCID: PMC5891216
- DOI: 10.1021/acsami.7b04622
Parallel Compression Is a Fast Low-Cost Assay for the High-Throughput Screening of Mechanosensory Cytoskeletal Proteins in Cells
Abstract
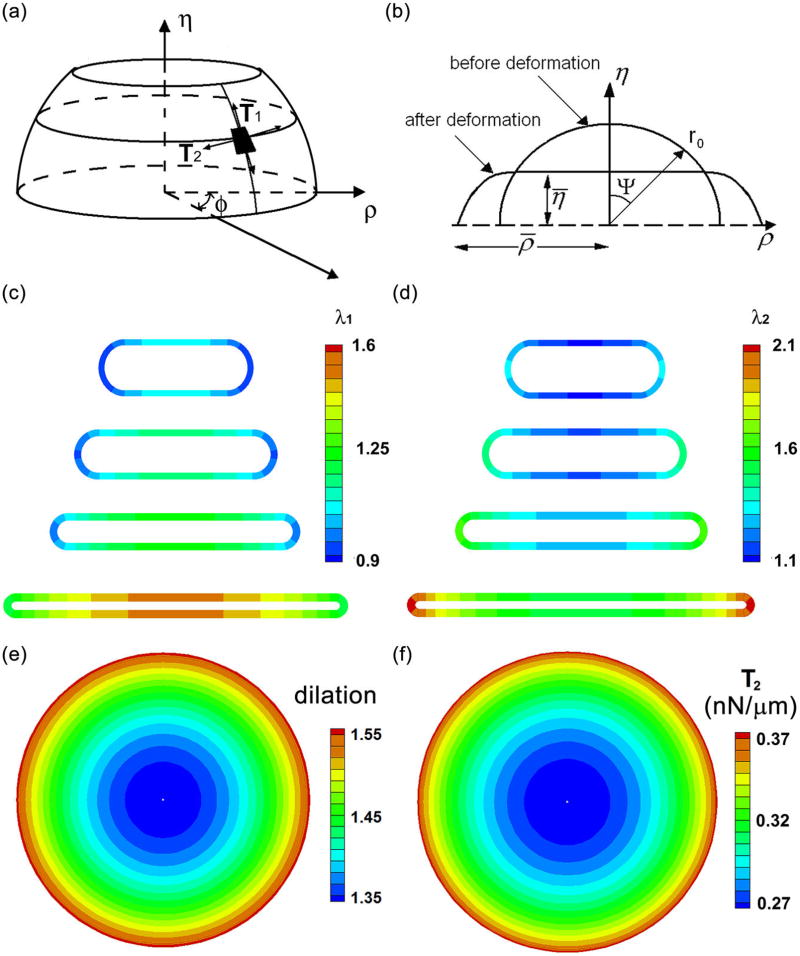
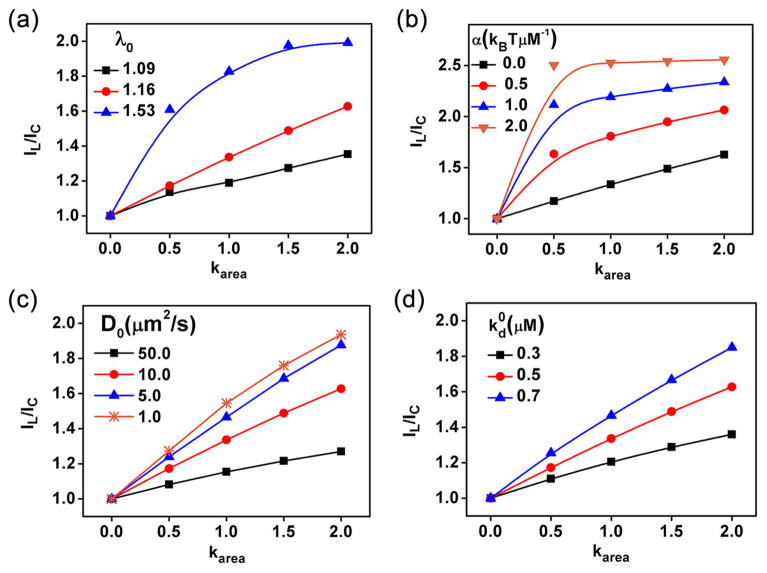
Cellular mechanosensing is critical for many biological processes, including cell differentiation, proliferation, migration, and tissue morphogenesis. The actin cytoskeletal proteins play important roles in cellular mechanosensing. Many techniques have been used to investigate the mechanosensory behaviors of these proteins. However, a fast, low-cost assay for the quantitative characterization of these proteins is still lacking. Here, we demonstrate that compression assay using agarose overlay is suitable for the high throughput screening of mechanosensory proteins in live cells while requiring minimal experimental setup. We used several well-studied myosin II mutants to assess the compression assay. On the basis of elasticity theories, we simulated the mechanosensory accumulation of myosin II's and quantitatively reproduced the experimentally observed protein dynamics. Combining the compression assay with confocal microscopy, we monitored the polarization of myosin II oligomers at the subcellular level. The polarization was dependent on the ratio of the two principal strains of the cellular deformations. Finally, we demonstrated that this technique could be used on the investigation of other mechanosensory proteins.
Keywords: actin filament; compression; mechanobiology; mechanosensing; mechanosensory accumulation; mechanotransduction; myosin II.
Conflict of interest statement
The authors declare no competing financial interest.
Figures


Similar articles
-
Cell shape regulation through mechanosensory feedback control.J R Soc Interface. 2015 Aug 6;12(109):20150512. doi: 10.1098/rsif.2015.0512. J R Soc Interface. 2015. PMID: 26224568 Free PMC article.
-
Long-range self-organization of cytoskeletal myosin II filament stacks.Nat Cell Biol. 2017 Feb;19(2):133-141. doi: 10.1038/ncb3466. Epub 2017 Jan 23. Nat Cell Biol. 2017. PMID: 28114270
-
Assembly and mechanosensory function of focal adhesions: experiments and models.Eur J Cell Biol. 2006 Apr;85(3-4):165-73. doi: 10.1016/j.ejcb.2005.11.001. Epub 2005 Dec 19. Eur J Cell Biol. 2006. PMID: 16360240 Review.
-
Lymphocyte-specific protein 1 regulates mechanosensory oscillation of podosomes and actin isoform-based actomyosin symmetry breaking.Nat Commun. 2018 Feb 6;9(1):515. doi: 10.1038/s41467-018-02904-x. Nat Commun. 2018. PMID: 29410425 Free PMC article.
-
Roles of the cytoskeleton, cell adhesion and rho signalling in mechanosensing and mechanotransduction.J Biochem. 2017 Mar 1;161(3):245-254. doi: 10.1093/jb/mvw082. J Biochem. 2017. PMID: 28082721 Review.
Cited by
-
The lectin Discoidin I acts in the cytoplasm to help assemble the contractile machinery.J Cell Biol. 2022 Nov 7;221(11):e202202063. doi: 10.1083/jcb.202202063. Epub 2022 Sep 27. J Cell Biol. 2022. PMID: 36165849 Free PMC article.
-
PCDH7 Inhibits the Formation of Homotypic Cell-in-Cell Structure.Front Cell Dev Biol. 2020 May 8;8:329. doi: 10.3389/fcell.2020.00329. eCollection 2020. Front Cell Dev Biol. 2020. PMID: 32457908 Free PMC article.
-
Discovery and Quantitative Dissection of Cytokinesis Mechanisms Using Dictyostelium discoideum.Methods Mol Biol. 2024;2814:1-27. doi: 10.1007/978-1-0716-3894-1_1. Methods Mol Biol. 2024. PMID: 38954194
-
Cell-in-cell structure mediates in-cell killing suppressed by CD44.Cell Discov. 2022 Apr 19;8(1):35. doi: 10.1038/s41421-022-00387-1. Cell Discov. 2022. PMID: 35436988 Free PMC article.
-
A continuum model of mechanosensation based on contractility kit assembly.Biophys J. 2025 Jan 7;124(1):62-76. doi: 10.1016/j.bpj.2024.10.020. Epub 2024 Nov 8. Biophys J. 2025. PMID: 39521955
References
-
- Geiger B, Spatz JP, Bershadsky AD. Environmental Sensing through Focal Adhesions. Nat Rev Mol Cell Biol. 2009;10(1):21–33. - PubMed
-
- Engler AJ, Sen S, Sweeney HL, Discher DE. Matrix Elasticity Directs Stem Cell Lineage Specification. Cell. 2006;126:677–689. - PubMed
-
- Prosser BL, Ward CW, Lederer WJ. X-ROS Signaling: Rapid Mechano-chemo Transduction in Heart. Science. 2011;333(6048):1440–1445. - PubMed
-
- Friedl P, Gilmour D. Collective Cell Migration in Morphogenesis, Regeneration and Cancer. Nat Rev Mol Cell Biol. 2009;10(7):445–457. - PubMed
MeSH terms
Substances
Grants and funding
LinkOut - more resources
Full Text Sources
Other Literature Sources
