

Hepatic Lipid Accumulation and Nrf2 Expression following Perinatal and Peripubertal Exposure to Bisphenol A in a Mouse Model of Nonalcoholic Liver Disease
- PMID: 28796629
- PMCID: PMC5783659
- DOI: 10.1289/EHP664
Hepatic Lipid Accumulation and Nrf2 Expression following Perinatal and Peripubertal Exposure to Bisphenol A in a Mouse Model of Nonalcoholic Liver Disease
Abstract
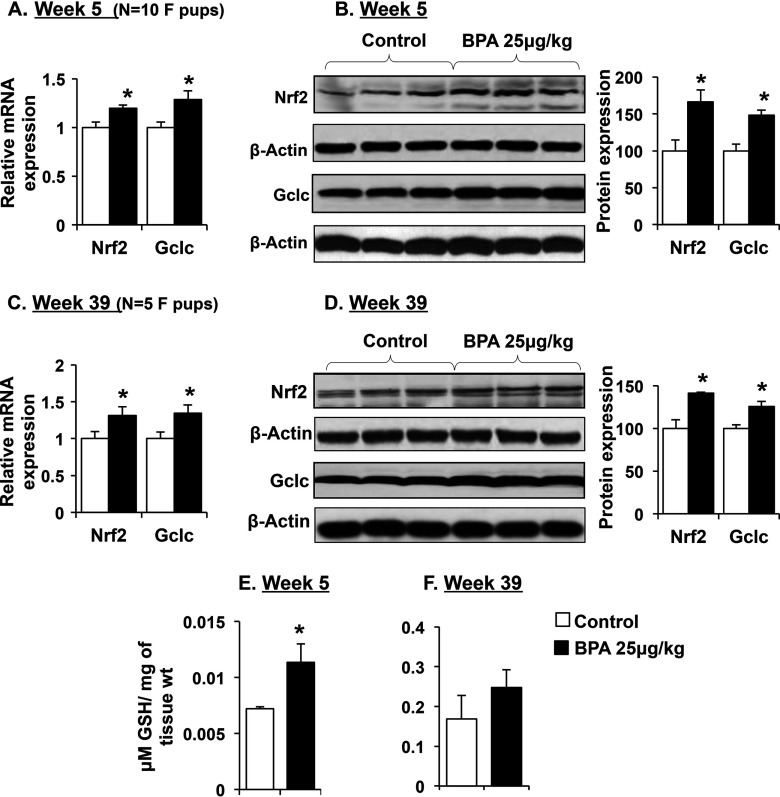
Background: Exposure to chemicals during critical windows of development may re-program liver for increased risk of nonalcoholic fatty liver disease (NAFLD). Bisphenol A (BPA), a plastics component, has been described to impart adverse effects during gestational and lactational exposure. Our work has pointed to nuclear factor E2-related factor 2 (Nrf2) being a modulator of hepatic lipid accumulation in models of NAFLD.
Objectives: To determine if chemical exposure can prime liver for steatosis via modulation of NRF2 and epigenetic mechanisms.
Methods: Utilizing BPA as a model exposure, pregnant CD-1 mice were administered 25μg/kg/day BPA via osmotic minipumps from gestational day 8 through postnatal day (PND)16. The offspring were weaned on PND21 and exposed to same dose of BPA via their drinking water through PND35. Tissues were collected from pups at week 5 (W5), and their littermates at week 39 (W39).
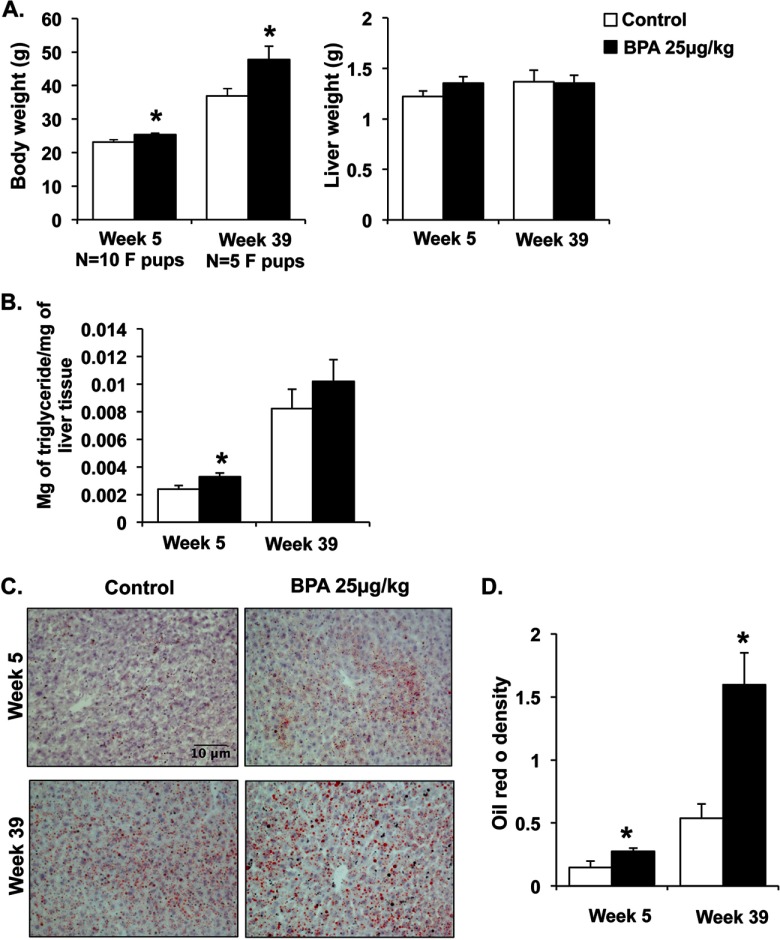
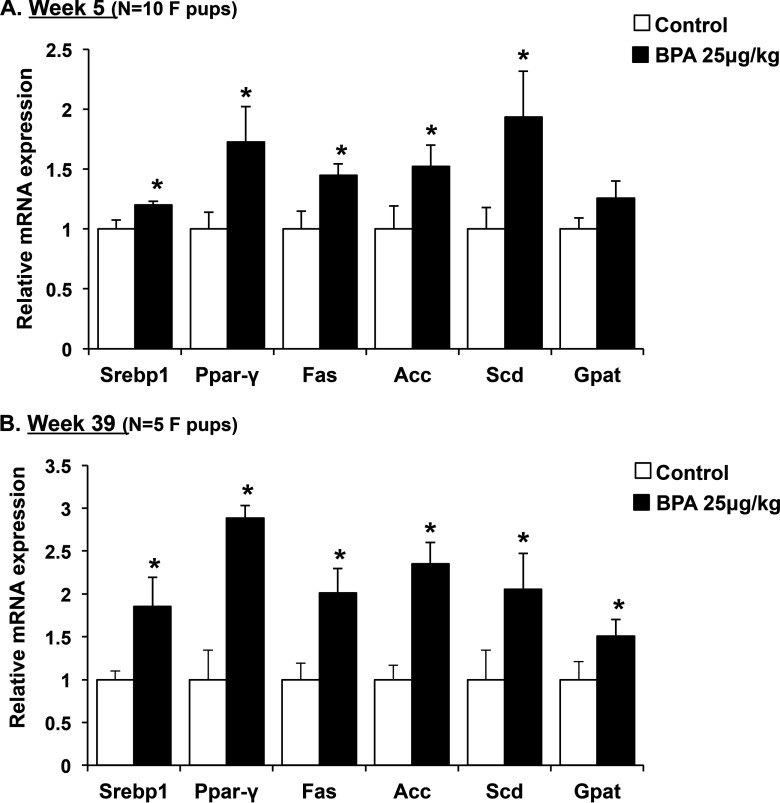
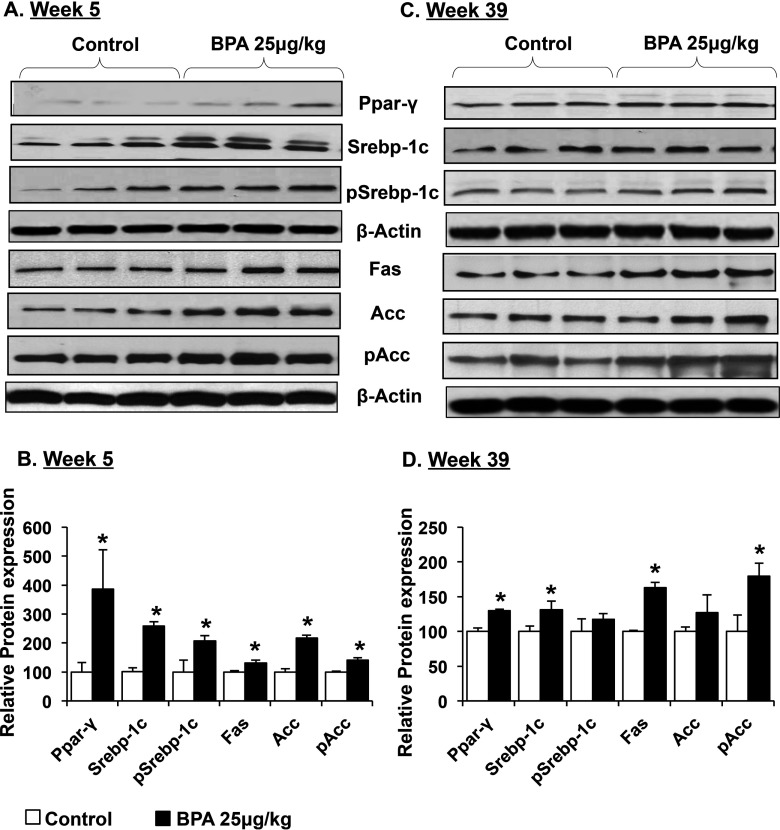
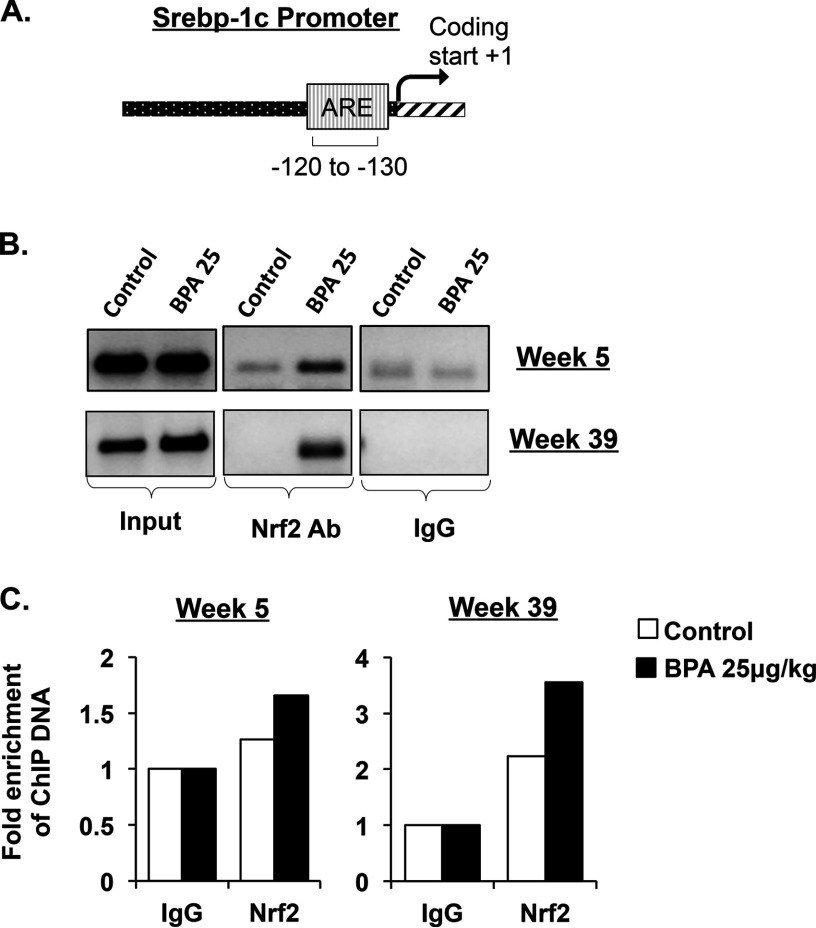
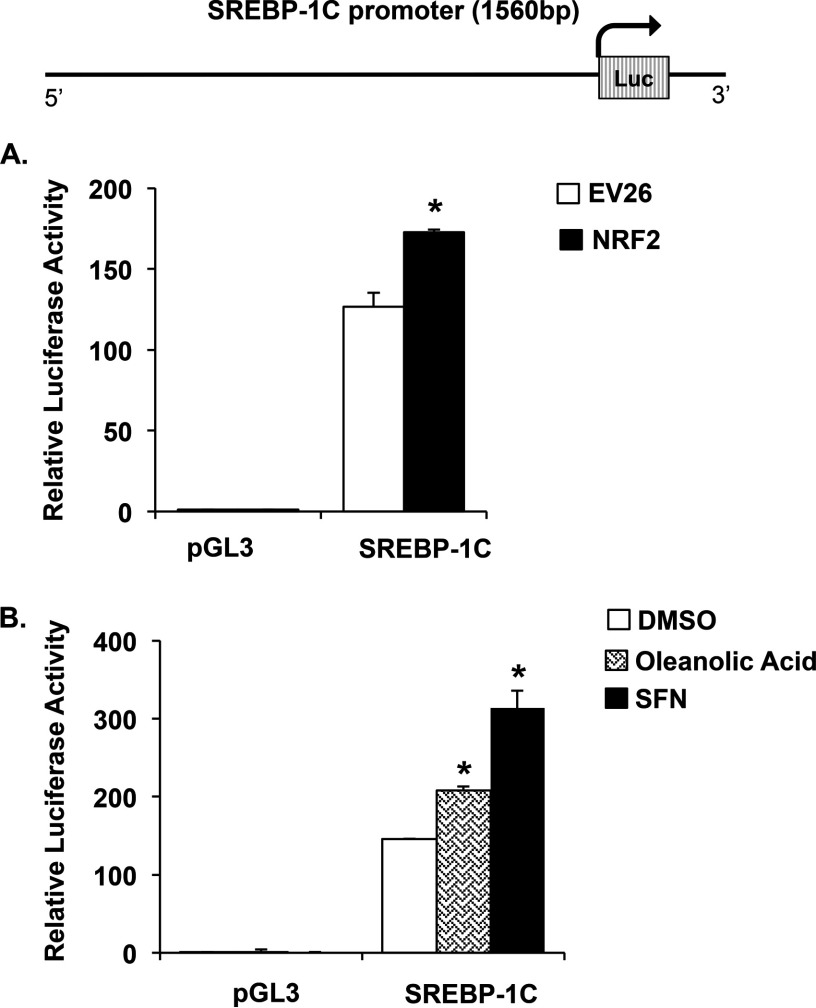
Results: BPA increased hepatic lipid content concomitant with increased Nrf2 and pro-lipogenic enzyme expression at W5 and W39 in female offspring. BPA exposure increased Nrf2 binding to a putative antioxidant response element consensus sequence in the sterol regulatory-element binding protein-1c (Srebp-1c) promoter. Known Nrf2 activators increased SREBP-1C promoter reporter activity in HepG2 cells. Methylated DNA immunoprecipitation-PCR and pyrosequencing revealed that developmental BPA exposure induced hypomethylation of the Nrf2 and Srebp-1c promoters in livers of W5 mice, which was more prominent in W39 mice than in others.
Conclusion: Exposure to a xenobiotic during early development induced persistent fat accumulation via hypomethylation of lipogenic genes. Moreover, increased Nrf2 recruitment to the Srebp-1c promoter in livers of BPA-exposed mice was observed. Overall, the underlying mechanisms described a broader impact beyond BPA exposure and can be applied to understand other models of NAFLD. https://doi.org/10.1289/EHP664.
Figures
![Figures 5A, 5B, and 5C depict changes in Srebp-1c, Fas and Nrf2 promoter methylation, respectively, after BPA exposure. The corresponding bar charts plot fold enrichment of MeDIP DNA in control and BPA-treated mice at Week 5 and Week 39].](https://cdn.ncbi.nlm.nih.gov/pmc/blobs/1819/5783659/cbcde0aeebb8/EHP664_f5.jpg)
Similar articles
-
Perinatal exposure to bisphenol a alters early adipogenesis in the rat.Environ Health Perspect. 2009 Oct;117(10):1549-55. doi: 10.1289/ehp.11342. Epub 2009 Jun 29. Environ Health Perspect. 2009. PMID: 20019905 Free PMC article.
-
Downregulation of miR-192 causes hepatic steatosis and lipid accumulation by inducing SREBF1: Novel mechanism for bisphenol A-triggered non-alcoholic fatty liver disease.Biochim Biophys Acta Mol Cell Biol Lipids. 2017 Sep;1862(9):869-882. doi: 10.1016/j.bbalip.2017.05.001. Epub 2017 May 5. Biochim Biophys Acta Mol Cell Biol Lipids. 2017. PMID: 28483554
-
Developmental bisphenol A (BPA) exposure leads to sex-specific modification of hepatic gene expression and epigenome at birth that may exacerbate high-fat diet-induced hepatic steatosis.Toxicol Appl Pharmacol. 2015 Apr 15;284(2):101-12. doi: 10.1016/j.taap.2015.02.021. Epub 2015 Mar 5. Toxicol Appl Pharmacol. 2015. PMID: 25748669 Free PMC article.
-
Prenatal exposure to bisphenol A and hyperactivity in children: a systematic review and meta-analysis.Environ Int. 2018 May;114:343-356. doi: 10.1016/j.envint.2017.12.028. Epub 2018 Mar 7. Environ Int. 2018. PMID: 29525285
-
Effects of BPA on female reproductive function: The involvement of epigenetic mechanism.Gen Comp Endocrinol. 2017 May 1;245:122-126. doi: 10.1016/j.ygcen.2016.08.010. Epub 2016 Aug 30. Gen Comp Endocrinol. 2017. PMID: 27591071 Review.
Cited by
-
Bisphenol-A analogue (bisphenol-S) exposure alters female reproductive tract and apoptosis/oxidative gene expression in blastocyst-derived cells.Iran J Basic Med Sci. 2020 May;23(5):576-585. doi: 10.22038/IJBMS.2020.40893.9664. Iran J Basic Med Sci. 2020. PMID: 32742594 Free PMC article.
-
The effects of trans fat diet intake on metabolic parameters and pancreatic tissue in offspring of prenatal bisphenol A exposed rats.Sci Rep. 2023 Jun 8;13(1):9322. doi: 10.1038/s41598-023-36043-1. Sci Rep. 2023. PMID: 37291156 Free PMC article.
-
Bisphenol a downregulates GLUT4 expression by activating aryl hydrocarbon receptor to exacerbate polycystic ovary syndrome.Cell Commun Signal. 2024 Jan 10;22(1):28. doi: 10.1186/s12964-023-01410-y. Cell Commun Signal. 2024. PMID: 38200540 Free PMC article.
-
Emerging contaminants: A One Health perspective.Innovation (Camb). 2024 Mar 13;5(4):100612. doi: 10.1016/j.xinn.2024.100612. eCollection 2024 Jul 1. Innovation (Camb). 2024. PMID: 38756954 Free PMC article. Review.
-
Non-alcoholic Fatty Liver Disease Induced by Perinatal Exposure to Bisphenol a Is Associated With Activated mTOR and TLR4/NF-κB Signaling Pathways in Offspring Rats.Front Endocrinol (Lausanne). 2019 Sep 10;10:620. doi: 10.3389/fendo.2019.00620. eCollection 2019. Front Endocrinol (Lausanne). 2019. PMID: 31551937 Free PMC article.
References
-
- Al-Eryani L, Wahlang B, Falkner KC, Guardiola JJ, Clair HB, Prough RA, et al. . 2014. Identification of environmental chemicals associated with the development of toxicant-associated fatty liver disease in rodents. Toxicol Pathol 43(4):482–97, PMID: 25326588, 10.1177/0192623314549960. - DOI - PMC - PubMed
-
- Anglea BM, PhuongDoa N, Ponzia D, Stahlhuta RW, Drurya BE, Nagel SC, et al. . 2013. Metabolic disruption in male mice due to fetal exposure to low but not high doses of bisphenol A (BPA): evidence for effects on body weight, food intake, adipocytes, leptin, adiponectin, insulin and glucose regulation. Reprod Toxicol 42:256–268, 10.1016/j.reprotox.2013.07.017. - DOI - PMC - PubMed
Publication types
MeSH terms
Substances
Grants and funding
LinkOut - more resources
Full Text Sources
Other Literature Sources
Medical
