

Multiple introductions of the dengue vector, Aedes aegypti, into California
- PMID: 28796789
- PMCID: PMC5552028
- DOI: 10.1371/journal.pntd.0005718
Multiple introductions of the dengue vector, Aedes aegypti, into California
Abstract
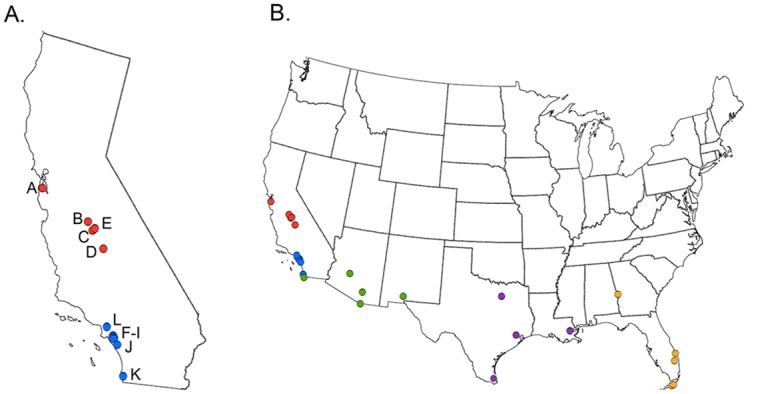
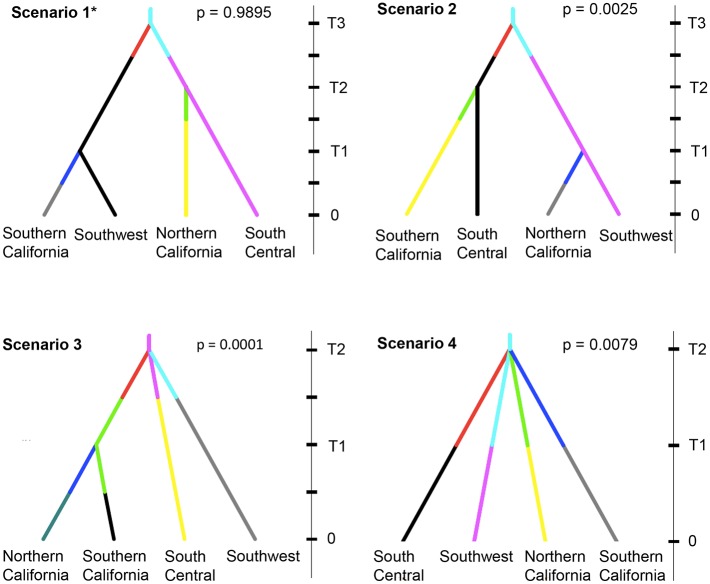
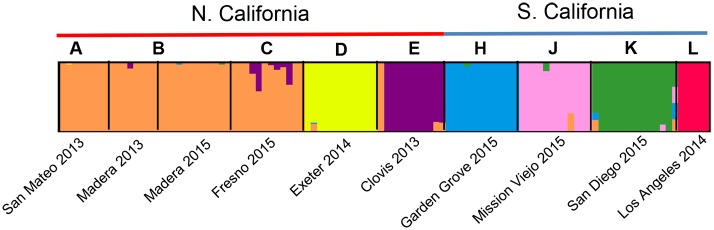
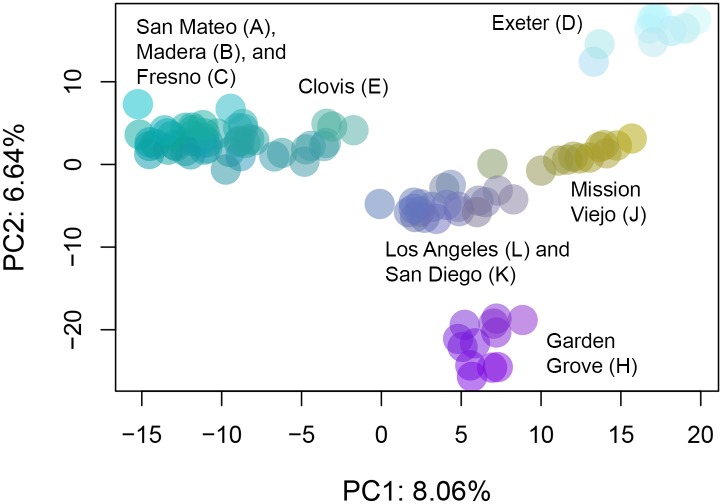
The yellow fever mosquito Aedes aegypti inhabits much of the tropical and subtropical world and is a primary vector of dengue, Zika, and chikungunya viruses. Breeding populations of A. aegypti were first reported in California (CA) in 2013. Initial genetic analyses using 12 microsatellites on collections from Northern CA in 2013 indicated the South Central US region as the likely source of the introduction. We expanded genetic analyses of CA A. aegypti by: (a) examining additional Northern CA samples and including samples from Southern CA, (b) including more southern US populations for comparison, and (c) genotyping a subset of samples at 15,698 SNPs. Major results are: (1) Northern and Southern CA populations are distinct. (2) Northern populations are more genetically diverse than Southern CA populations. (3) Northern and Southern CA groups were likely founded by two independent introductions which came from the South Central US and Southwest US/northern Mexico regions respectively. (4) Our genetic data suggest that the founding events giving rise to the Northern CA and Southern CA populations likely occurred before the populations were first recognized in 2013 and 2014, respectively. (5) A Northern CA population analyzed at multiple time-points (two years apart) is genetically stable, consistent with permanent in situ breeding. These results expand previous work on the origin of California A. aegypti with the novel finding that this species entered California on multiple occasions, likely some years before its initial detection. This work has implications for mosquito surveillance and vector control activities not only in California but also in other regions where the distribution of this invasive mosquito is expanding.
Conflict of interest statement
The authors have declared that no competing interests exist.
Figures

References
-
- Paules CI, Fauci AS. Yellow fever—Once again on the radar screen in the Americas. N Engl J Med. 2017;376(15):1397–9. doi: 10.1056/NEJMp1702172 - DOI - PubMed
-
- Global Strategy for Dengue Prevention and Control 2012–2020. World Health Organization; 2012. http://apps.who.int/iris/bitstream/10665/75303/1/9789241504034_eng.pdf.
-
- Bhatt S, Gething PW, Brady OJ, Messina JP, Farlow AW, Moyes CL, et al. The global distribution and burden of dengue. Nature. 2013;496(7446):504–7. doi: 10.1038/nature12060 - DOI - PMC - PubMed
-
- Halstead SB. Dengue virus-mosquito interactions. Annu Rev Entomol. 2008;53:273–91. doi: 10.1146/annurev.ento.53.103106.093326 - DOI - PubMed
-
- All Countries & Territories with Active Zika Virus Transmission. Centers for Disease Control and Prevention. 2016. http://www.cdc.gov/zika/geo/active-countries.html.
MeSH terms
Grants and funding
LinkOut - more resources
Full Text Sources
Other Literature Sources
Molecular Biology Databases
