Legacy of historic ozone exposure on plant community and food web structure
- PMID: 28796821
- PMCID: PMC5552163
- DOI: 10.1371/journal.pone.0182796
Legacy of historic ozone exposure on plant community and food web structure
Abstract
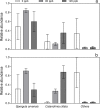
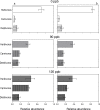
Information on whole community responses is needed to predict direction and magnitude of changes in plant and animal abundance under global changes. This study quantifies the effect of past ozone exposure on a weed community structure and arthropod colonization. We used the soil seed bank resulting from a long-term ozone exposure to reestablish the plant community under a new low-pollution environment. Two separate experiments using the same original soil seed bank were conducted. Plant and arthropod richness and species abundance was assessed during two years. We predicted that exposure to episodic high concentrations of ozone during a series of growing cycles would result in plant assemblies with lower diversity (lower species richness and higher dominance), due to an increase in dominance of the stress tolerant species and the elimination of the ozone-sensitive species. As a consequence, arthropod-plant interactions would also be changed. Species richness of the recruited plant communities from different exposure histories was similar (≈ 15). However, the relative abundance of the dominant species varied according to history of exposure, with two annual species dominating ozone enriched plots (90 ppb: Spergula arvensis, and 120 ppb: Calandrinia ciliata). Being consistent both years, the proportion of carnivore species was significantly higher in plots with history of higher ozone concentration (≈3.4 and ≈7.7 fold higher in 90 ppb and 120 ppb plots, respectively). Our study provides evidence that, past history of pollution might be as relevant as management practices in structuring agroecosystems, since we show that an increase in tropospheric ozone may influence biotic communities even years after the exposure.
Conflict of interest statement
Figures


Similar articles
-
Ozone exposure of a weed community produces adaptive changes in seed populations of Spergula arvensis.PLoS One. 2013 Sep 26;8(9):e75820. doi: 10.1371/journal.pone.0075820. eCollection 2013. PLoS One. 2013. PMID: 24086640 Free PMC article.
-
Experimental Manipulation of Grassland Plant Diversity Induces Complex Shifts in Aboveground Arthropod Diversity.PLoS One. 2016 Feb 9;11(2):e0148768. doi: 10.1371/journal.pone.0148768. eCollection 2016. PLoS One. 2016. PMID: 26859496 Free PMC article.
-
Responses of terrestrial arthropods to air pollution: a meta-analysis.Environ Sci Pollut Res Int. 2010 Feb;17(2):297-311. doi: 10.1007/s11356-009-0138-0. Epub 2009 Mar 25. Environ Sci Pollut Res Int. 2010. PMID: 19319587 Review.
-
Floral diversity increases beneficial arthropod richness and decreases variability in arthropod community composition.Ecol Appl. 2013 Jan;23(1):86-95. doi: 10.1890/11-2029.1. Ecol Appl. 2013. PMID: 23495638
-
Effects of invasive plants on arthropods.Conserv Biol. 2014 Dec;28(6):1532-49. doi: 10.1111/cobi.12350. Epub 2014 Jul 26. Conserv Biol. 2014. PMID: 25065640 Review.
Cited by
-
Plant age at the time of ozone exposure affects flowering patterns, biotic interactions and reproduction of wild mustard.Sci Rep. 2021 Dec 6;11(1):23448. doi: 10.1038/s41598-021-02878-9. Sci Rep. 2021. PMID: 34873217 Free PMC article.
-
Ozone affects plant, insect, and soil microbial communities: A threat to terrestrial ecosystems and biodiversity.Sci Adv. 2020 Aug 12;6(33):eabc1176. doi: 10.1126/sciadv.abc1176. eCollection 2020 Aug. Sci Adv. 2020. PMID: 32851188 Free PMC article. Review.
References
-
- Bellard C, Bertelsmeier C, Leadley P, Thuiller W, Courchamp F (2012) Impacts of climate change on the future of biodiversity. Ecol Lett 15: 365–377. doi: 10.1111/j.1461-0248.2011.01736.x - DOI - PMC - PubMed
-
- Young PJ, Archibald AT, Bowman KW, Lamarque J-F, Naik V, Stevenson DS, et al. (2013) Pre-industrial to end 21st century projections of tropospheric ozone from the Atmospheric Chemistry and Climate Model Intercomparison Project (ACCMIP). Atmos Chem Phys 13: 2063–2090.
-
- Kawase H, Nagashima T, Sudo K, Nozawa T (2011) Future changes in tropospheric ozone under Representative Concentration Pathways (RCPs), Geophys Res Lett 38: 1–6.
-
- Zhao Y, Zhang J, Nielsen CP (2013) The effects of recent control policies on trends in emissions of anthropogenic atmospheric pollutants and CO2 in China. Atmos Chem Phys 13: 487–508.
-
- Zhou W, Cohan DS, Henderson BH (2014) Slower ozone production in Houston, Texas following emission reductions: evidence from Texas Air Quality Studies in 2000 and 2006. Atmos Chem Phys 14: 2777–2788.
MeSH terms
Substances
LinkOut - more resources
Full Text Sources
Other Literature Sources
Medical
Research Materials
Miscellaneous

