

Association Between the Asp312Asn, Lys751Gln, and Arg156Arg Polymorphisms in XPD and the Risk of Prostate Cancer
- PMID: 28797198
- PMCID: PMC5762072
- DOI: 10.1177/1533034617724678
Association Between the Asp312Asn, Lys751Gln, and Arg156Arg Polymorphisms in XPD and the Risk of Prostate Cancer
Abstract
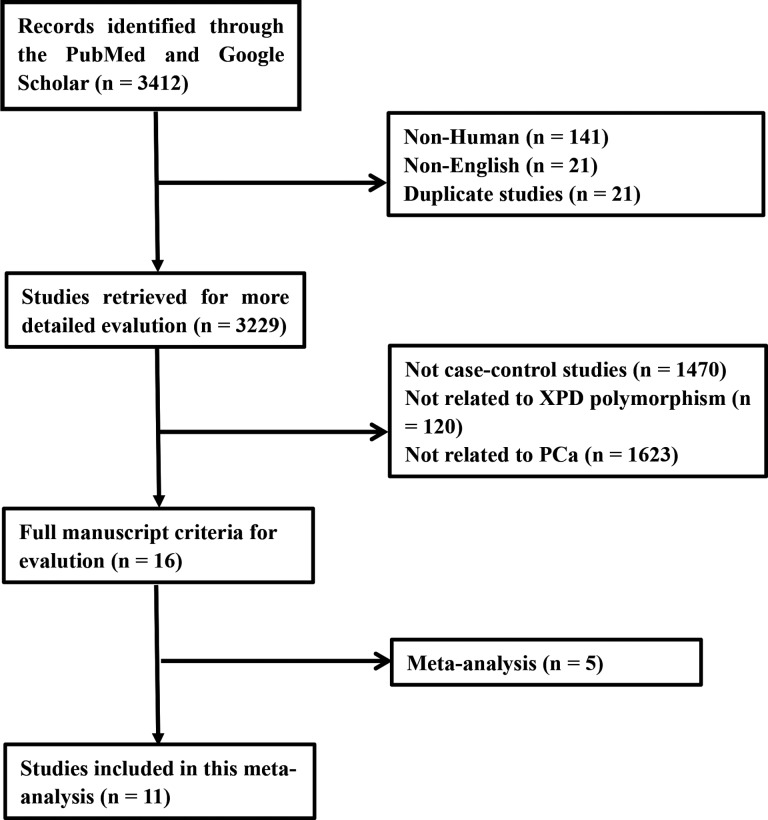
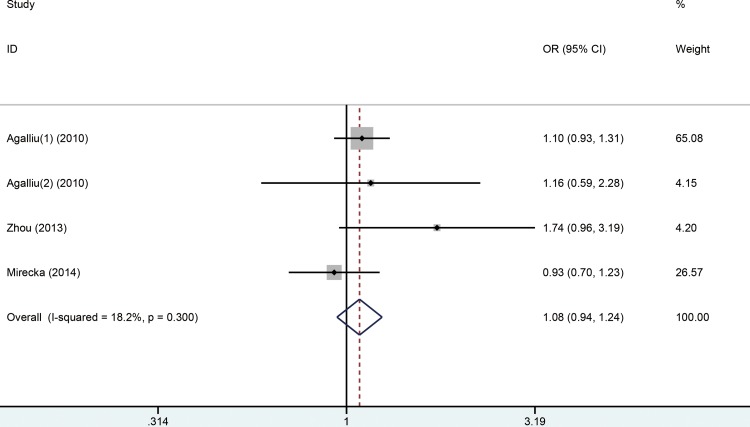
Prostate cancer is the most common solid cancer and genetic factors play important roles in its pathogenesis. XPD is one of the 8 core genes involved in the nucleotide excision repair pathway. The relationship between Asp312Asn, Lys751Gln, and Arg156Arg polymorphisms in XPD and prostate cancer risk is a controversial topic. Therefore, we conducted a meta-analysis to explore the relationship between these 3 polymorphisms and the risk of developing prostate cancer. We searched the electronic literature in PubMed and Google Scholar for all relevant studies (last updated January 1, 2017). The pooled odds ratios and 95% confidence intervals for the associations between the Asp312Asn, Lys751Gln, or Arg156Arg polymorphisms in XPD and prostate cancer risk were calculated. To evaluate the effects of specific study characteristics on the association of these 3 polymorphisms and prostate cancer risk, we performed subgroup analysis if 2 or more studies were available. After an extensive literature review, 7 publications regarding Asp312Asn genotype distribution with 8 case-controls, 9 publications regarding Lys751Gln genotype distribution with 10 case-controls, and 3 publications regarding Arg156Arg genotype distribution with 4 case-controls were selected. The results showed that Asp312Asn (odds ratio = 1.34, 95% confidence interval: 0.96-1.87, P = .000), Lys751Gln (odds ratio = 0.98, 95% confidence interval: 0.89-1.08, P = .986), and Arg156Arg (odds ratio = 1.05, 95% confidence interval: 0.91-1.22, P = .57) polymorphisms do not increase the risk of prostate cancer in the dominant model. Further, in the subgroup analysis by ethnicity, no relationships were observed between Lys751Gln and Arg156Arg polymorphisms and prostate cancer risk. However, stratified analysis by ethnicity revealed that Asp312Asn affects African (odds ratio = 1.57, 95% confidence interval: 1.06-2.33, P = .382) and Asian populations (odds ratio = 2.09, 95% confidence interval: 1.39-3.14, P = .396) in homozygote comparison. In conclusion, this meta-analysis suggests that there is no general association between the Asp312Asn, Lys751Gln, and Arg156Arg polymorphisms in XPD and prostate cancer susceptibility.
Keywords: Arg156Arg; Asp312Asn; Lys751Gln; XPD; meta-analysis; prostate cancer.
Conflict of interest statement
Figures


Similar articles
-
Genetic polymorphisms of xeroderma pigmentosum group D gene Asp312Asn and Lys751Gln and susceptibility to prostate cancer: a systematic review and meta-analysis.Gene. 2013 Nov 10;530(2):309-14. doi: 10.1016/j.gene.2013.08.053. Epub 2013 Aug 23. Gene. 2013. PMID: 23973729
-
XPD Lys751Gln and Asp312Asn polymorphisms and gastric cancer susceptibility: a meta-analysis of case-control studies.Asian Pac J Cancer Prev. 2013;14(1):231-6. doi: 10.7314/apjcp.2013.14.1.231. Asian Pac J Cancer Prev. 2013. PMID: 23534729
-
Genetic polymorphisms of xeroderma pigmentosum group D and prostate cancer risk: a meta-analysis.J Cancer Res Ther. 2013 Apr-Jun;9(2):187-92. doi: 10.4103/0973-1482.113345. J Cancer Res Ther. 2013. PMID: 23771356 Review.
-
XPD Lys751Gln and Asp312Asn polymorphisms and susceptibility to skin cancer: a meta-analysis of 17 case-control studies.Asian Pac J Cancer Prev. 2014;15(16):6619-25. doi: 10.7314/apjcp.2014.15.16.6619. Asian Pac J Cancer Prev. 2014. PMID: 25169498
-
ERCC2/XPD Lys751Gln and Asp312Asn gene polymorphism and lung cancer risk: a meta-analysis involving 22 case-control studies.J Thorac Oncol. 2010 Sep;5(9):1337-45. doi: 10.1097/JTO.0b013e3181e7fe2a. J Thorac Oncol. 2010. PMID: 20651612
Cited by
-
Association of ERCC2 Gene Polymorphisms with Susceptibility to Diffuse Large B-Cell Lymphoma.Med Sci Monit. 2018 Oct 3;24:7015-7022. doi: 10.12659/MSM.908813. Med Sci Monit. 2018. PMID: 30279407 Free PMC article.
-
Impact of Polymorphism in Base Excision Repair and Nucleotide Excision Repair Genes and Risk of Cervical Cancer: A Case-Control Study.Asian Pac J Cancer Prev. 2022 Apr 1;23(4):1291-1300. doi: 10.31557/APJCP.2022.23.4.1291. Asian Pac J Cancer Prev. 2022. PMID: 35485688 Free PMC article.
-
The prognostic and diagnostic values of MicroRNA-10b in gastric cancer: A comprehensive study based on meta-analysis and TCGA database.Medicine (Baltimore). 2020 Jun 5;99(23):e20508. doi: 10.1097/MD.0000000000020508. Medicine (Baltimore). 2020. PMID: 32501997 Free PMC article.
-
A Drosophila platform identifies a novel, personalized therapy for a patient with adenoid cystic carcinoma.iScience. 2021 Feb 20;24(3):102212. doi: 10.1016/j.isci.2021.102212. eCollection 2021 Mar 19. iScience. 2021. PMID: 33733072 Free PMC article.
References
-
- Siegel RL, Miller KD, Jemal A. Cancer statistics, 2015. CA Cancer J Clin. 2015;65(1):5–29. - PubMed
-
- Cao DL, Ye DW, Zhang HL, et al. A multiplex model of combining gene-based, protein-based, and metabolite-based with positive and negative markers in urine for the early diagnosis of prostate cancer. Prostate. 2011;71(7):700–710. - PubMed
-
- Chen PL, Li WT, Wang J, et al. Association between MTHFR gene polymorphisms (C677 T, A1298C) and genetic susceptibility to prostate cancer: a meta-analysis. Genet Mol Res. 2015;14(4):19191–19202. - PubMed
-
- Steinberg GD, Carter BS, Beaty TH, et al. Family history and the risk of prostate cancer. Prostate. 1990;17(4):337–347. - PubMed
LinkOut - more resources
Full Text Sources
Other Literature Sources
Research Materials
