

Comparison of manual & automated analysis methods for corneal endothelial cell density measurements by specular microscopy
- PMID: 28797649
- PMCID: PMC6039579
- DOI: 10.1016/j.optom.2017.06.001
Comparison of manual & automated analysis methods for corneal endothelial cell density measurements by specular microscopy
Abstract
Purpose: To determine the reliability of corneal endothelial cell density (ECD) obtained by automated specular microscopy versus that of validated manual methods and factors that predict such reliability.
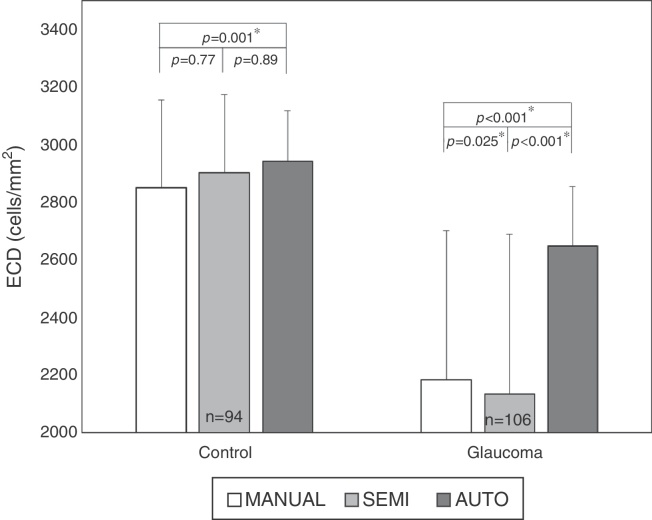
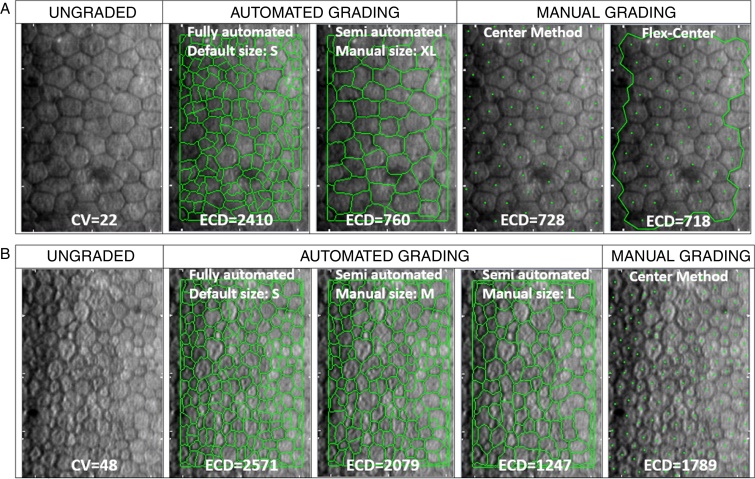
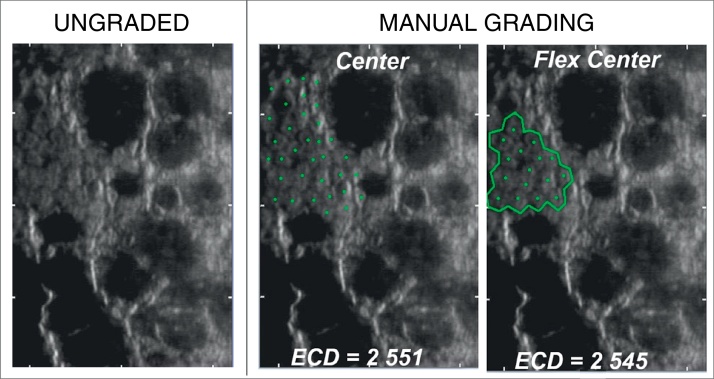
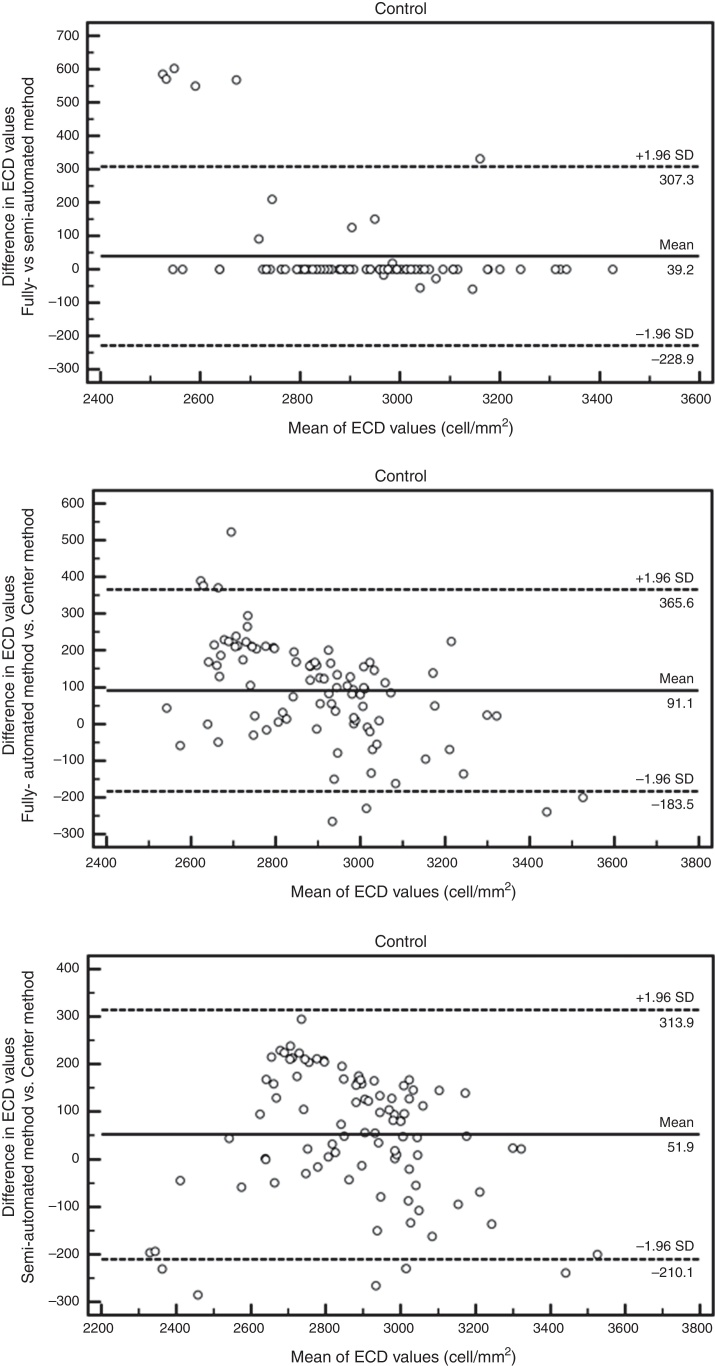
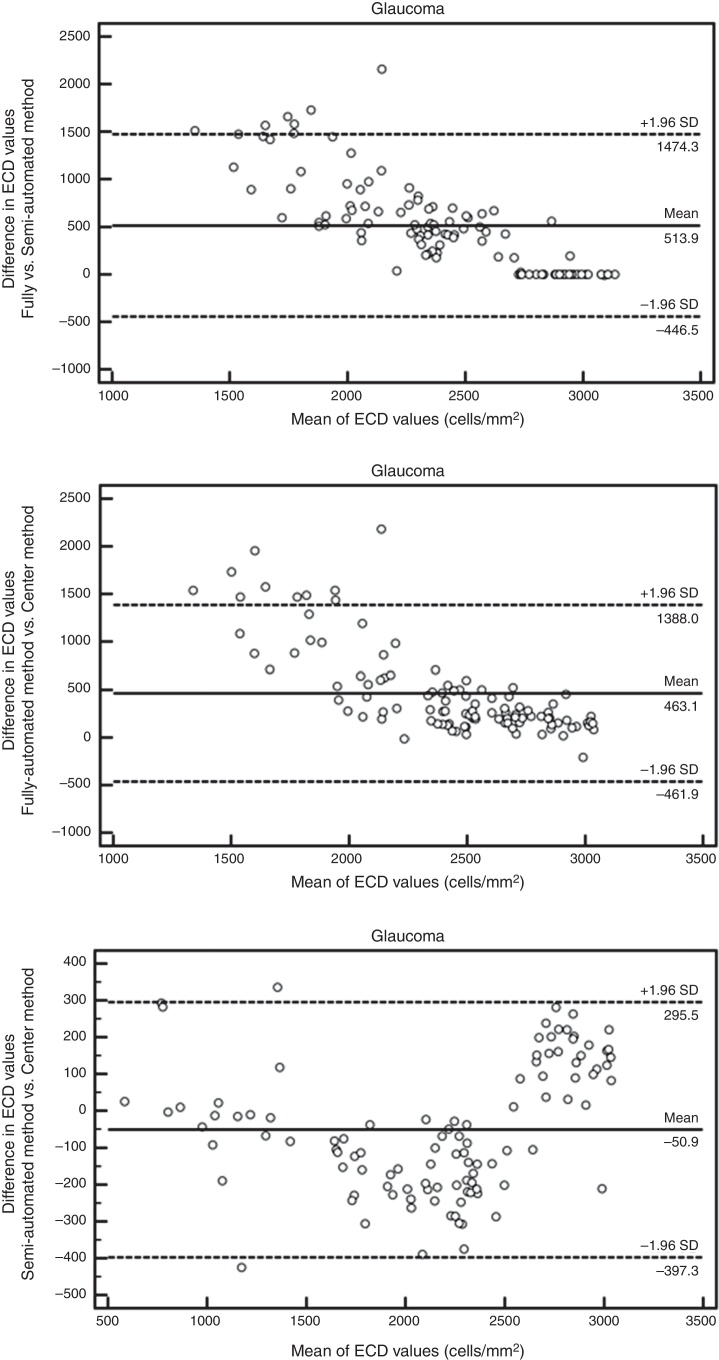
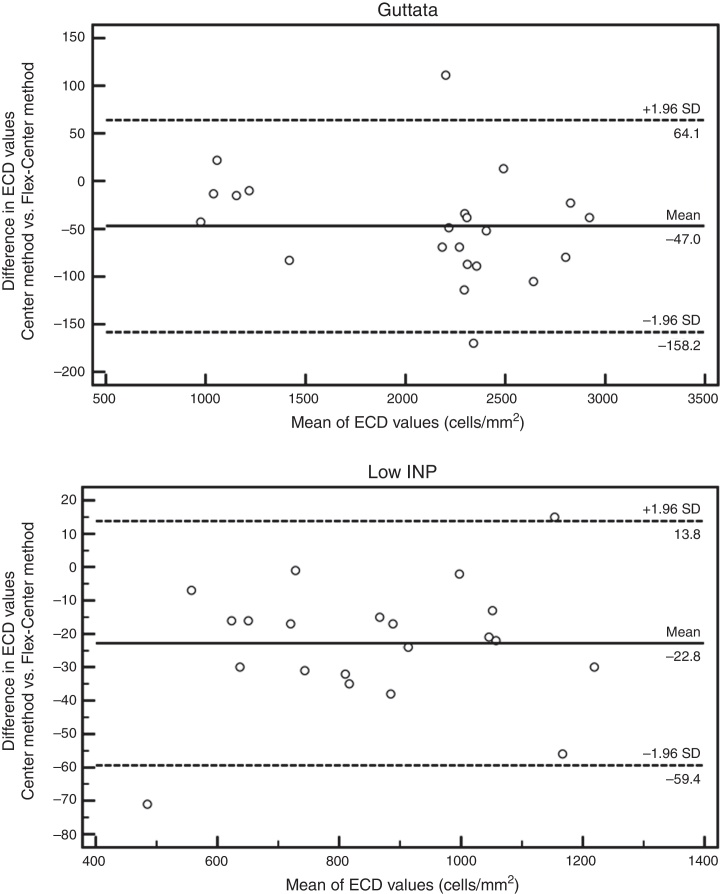
Methods: Sharp central images from 94 control and 106 glaucomatous eyes were captured with Konan specular microscope NSP-9900. All images were analyzed by trained graders using Konan CellChek Software, employing the fully- and semi-automated methods as well as Center Method. Images with low cell count (input cells number <100) and/or guttata were compared with the Center and Flex-Center Methods. ECDs were compared and absolute error was used to assess variation. The effect on ECD of age, cell count, cell size, and cell size variation was evaluated.
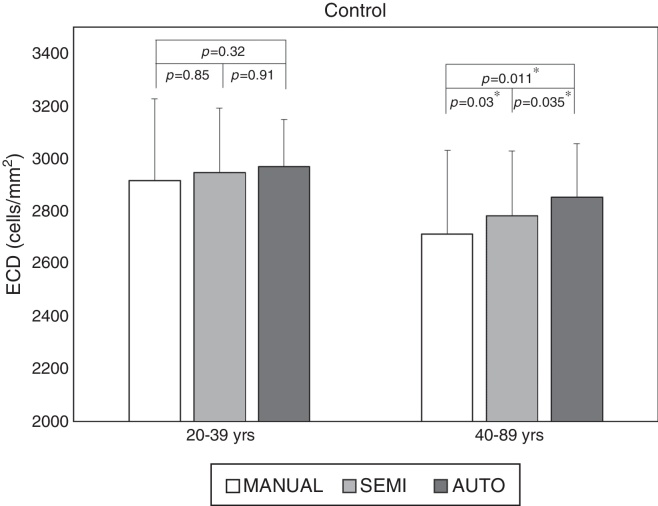
Results: No significant difference was observed between the Center and Flex-Center Methods in corneas with guttata (p=0.48) or low ECD (p=0.11). No difference (p=0.32) was observed in ECD of normal controls <40 yrs old between the fully-automated method and manual Center Method. However, in older controls and glaucomatous eyes, ECD was overestimated by the fully-automated method (p=0.034) and semi-automated method (p=0.025) as compared to manual method.
Conclusion: Our findings show that automated analysis significantly overestimates ECD in the eyes with high polymegathism and/or large cell size, compared to the manual method. Therefore, we discourage reliance upon the fully-automated method alone to perform specular microscopy analysis, particularly if an accurate ECD value is imperative.
Objetivo: Determinar la fiabilidad de la densidad celular endotelial corneal (ECD) obtenida mediante microscopio especular automático frente a métodos manuales validados y factores predictivos de la fiabilidad.
Métodos: Se capturaron imágenes nítidas de 94 controles y 106 ojos glaucomatosos con un microscopio especular Konan NSP-9900. Todas las imágenes fueron analizadas por examinadores expertos mediante el software Konan CellChek, utilizando los métodos automatizado total, semiautomático y de centrado. Se compararon las imágenes con bajo recuento celular (número de células <100) y/o córnea guttata con el método de centrado y centrado flexible. Se compararon las ECD, utilizándose el error absoluto para valorar la variación. Se evaluó el efecto de la ECD sobre la edad, el recuento celular, el tamaño celular y la variación del tamaño celular.
Resultados: No se observó diferencia significativa entre los métodos de centrado y centrado flexible en las córneas con guttata (p = 0,48) o baja ECD (p = 0,11). No se observó diferencia (p = 0,32) en cuanto a ECD en los controles normales < 40 años entre el método totalmente automatizado y el método de centrado manual. Sin embargo, en los controles mayores y en los ojos glaucomatosos, la ECD fue sobreestimada por el método totalmente automatizado (p = 0,034) y el método semiautomático (p = 0,025), en comparación al método manual.
Conclusión: Nuestros hallazgos muestran que los análisis automatizados sobreestiman considerablemente la ECD en los ojos con alto polimegatismo y/o gran tamaño celular, en comparación al método manual. Por tanto, no recomendamos confiar en el método totalmente automatizado por sí solo para realizar estudios mediante microscopio especular, particularmente en casos en que la precisión del valor de ECD sea imperativo.
Keywords: Automated method; Center Method; Corneal endothelial cell density; Densidad celular endotelial corneal; Flex-Center Method; Microscopio especular; Método automatizado; Método de centrado; Método de centrado flexible; Specular microscopy.
Copyright © 2017. Published by Elsevier España, S.L.U.
Figures
Similar articles
-
Comparison of Noncontact Specular and Confocal Microscopy for Evaluation of Corneal Endothelium.Eye Contact Lens. 2018 Sep;44 Suppl 1:S144-S150. doi: 10.1097/ICL.0000000000000362. Eye Contact Lens. 2018. PMID: 28346276
-
Comparison of semi-automated center-dot and fully automated endothelial cell analyses from specular microscopy images.Int Ophthalmol. 2018 Dec;38(6):2495-2507. doi: 10.1007/s10792-017-0760-7. Epub 2017 Oct 30. Int Ophthalmol. 2018. PMID: 29086325
-
Comparison of the Center and Flex-Center Methods of Corneal Endothelial Cell Analysis in the Presence of Guttae.Cornea. 2017 Dec;36(12):1514-1520. doi: 10.1097/ICO.0000000000001334. Cornea. 2017. PMID: 28834820
-
Assessment of corneal endothelial cell parameters using specular microscopy in previously infected SARS-CoV-2 patients.Int Ophthalmol. 2023 Aug;43(8):2983-2987. doi: 10.1007/s10792-023-02681-7. Epub 2023 Mar 11. Int Ophthalmol. 2023. PMID: 36906646 Free PMC article. Review.
-
Review of corneal endothelial specular microscopy for FDA clinical trials of refractive procedures, surgical devices, and new intraocular drugs and solutions.Cornea. 2008 Jan;27(1):1-16. doi: 10.1097/ICO.0b013e31815892da. Cornea. 2008. PMID: 18245960 Free PMC article. Review.
Cited by
-
Overestimation of corneal endothelial cell density by automated method in glaucomatous eyes with impaired corneal endothelial cells.Int Ophthalmol. 2022 Jan;42(1):133-145. doi: 10.1007/s10792-021-02008-4. Epub 2021 Sep 5. Int Ophthalmol. 2022. PMID: 34482487 Free PMC article.
-
Comparison of automated corneal endothelial cell analysis in healthy and postoperative eyes with phakic intraocular lens: a cross-sectional study and literature review.BMC Ophthalmol. 2024 Jul 30;24(1):318. doi: 10.1186/s12886-024-03590-8. BMC Ophthalmol. 2024. PMID: 39080583 Free PMC article. Review.
-
Unbiased corneal tissue analysis using Gabor-domain optical coherence microscopy and machine learning for automatic segmentation of corneal endothelial cells.J Biomed Opt. 2020 Aug;25(9):1-17. doi: 10.1117/1.JBO.25.9.092902. J Biomed Opt. 2020. PMID: 32770867 Free PMC article.
-
Machine Learning Analysis of Postkeratoplasty Endothelial Cell Images for the Prediction of Future Graft Rejection.Transl Vis Sci Technol. 2023 Feb 1;12(2):22. doi: 10.1167/tvst.12.2.22. Transl Vis Sci Technol. 2023. PMID: 36790821 Free PMC article.
-
Diagnostic Techniques to Increase the Safety of Phakic Intraocular Lenses.Diagnostics (Basel). 2023 Jul 27;13(15):2503. doi: 10.3390/diagnostics13152503. Diagnostics (Basel). 2023. PMID: 37568866 Free PMC article. Review.
References
-
- Siertsema J.V., Landesz M., van den Brom H., van Rij G. Automated video image morphometry of the corneal endothelium. Doc Ophthalmol. 1993;85:35–44. - PubMed
-
- Laing R.A. Image processing of corneal endothelial images. In: Cavanagh H.D., editor. The Cornea: Transactions of the World Congress on the Cornea, III. Raven Press; New York: 1988. pp. 259–265.
-
- Benetz B.A., Diaconu E., Bowlin S.J., Oak S.S., Laing R.A., Lass J.H. Comparison of corneal endothelial image analysis by Konan SP8000 noncontact and Bio-Optics Bambi systems. Cornea. 1999;18:67–72. - PubMed
-
- Seitz B., Müller E.E., Langenbucher A., Kus M.M., Naumann G.O. Reproducibility and validity of a new automatic method of specular microscopy analysis of corneal endothelium. Ophthalmologe. 1997;94:127–135. [in German] - PubMed
Publication types
MeSH terms
LinkOut - more resources
Full Text Sources
Other Literature Sources
Medical
