. 2017 Sep 22;357(6357):1299-1303.
doi: 10.1126/science.aan2399. Epub 2017 Aug 10.

Global mRNA polarization regulates translation efficiency in the intestinal epithelium

Affiliations

Global mRNA polarization regulates translation efficiency in the intestinal epithelium

Andreas E Moor et al. Science. .

Abstract

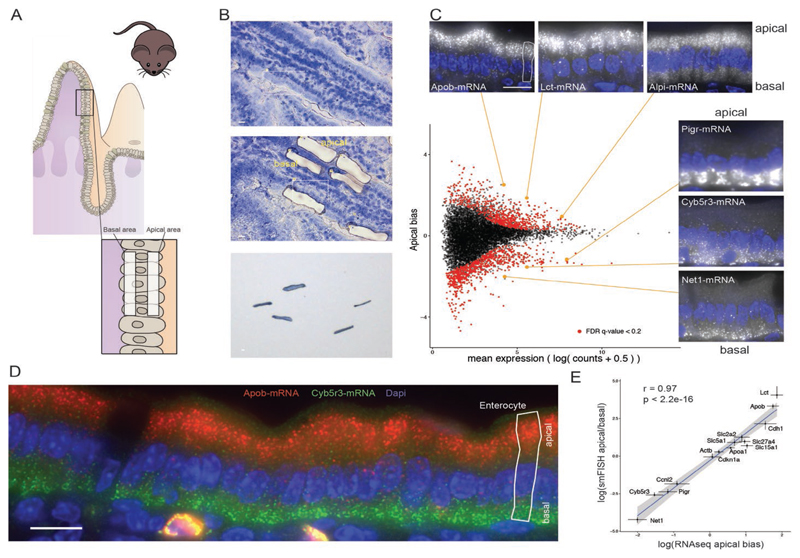
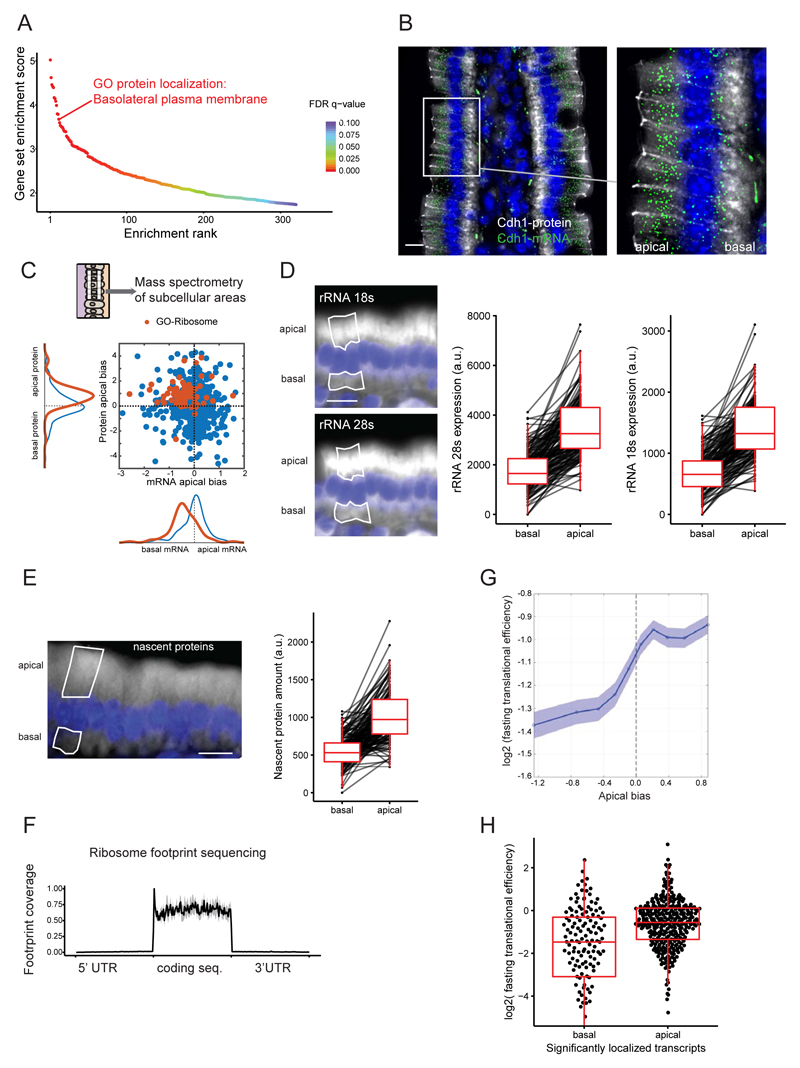
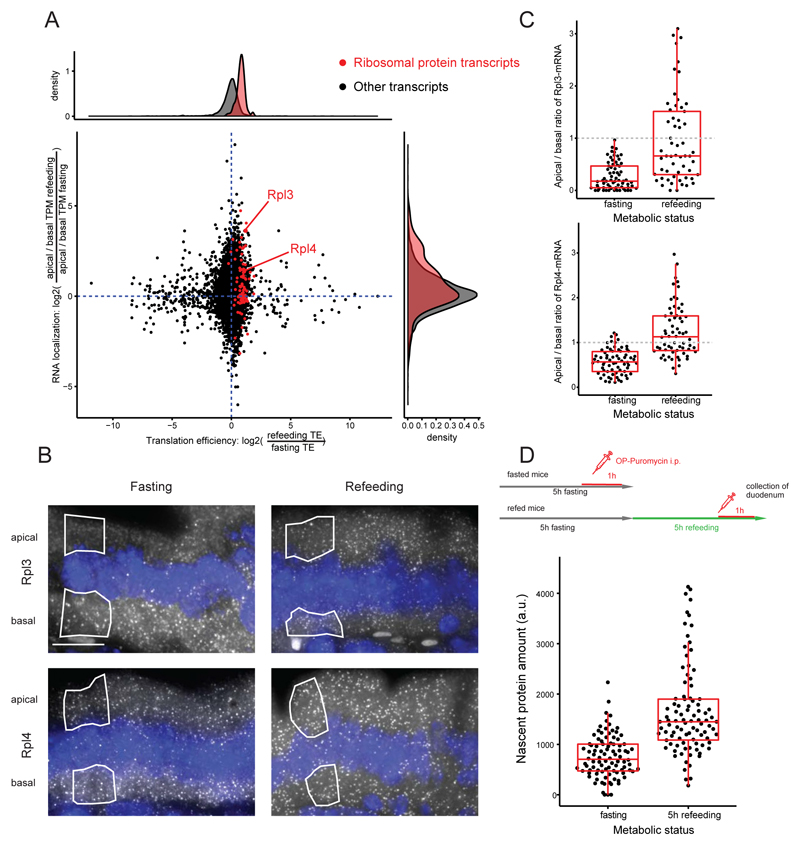
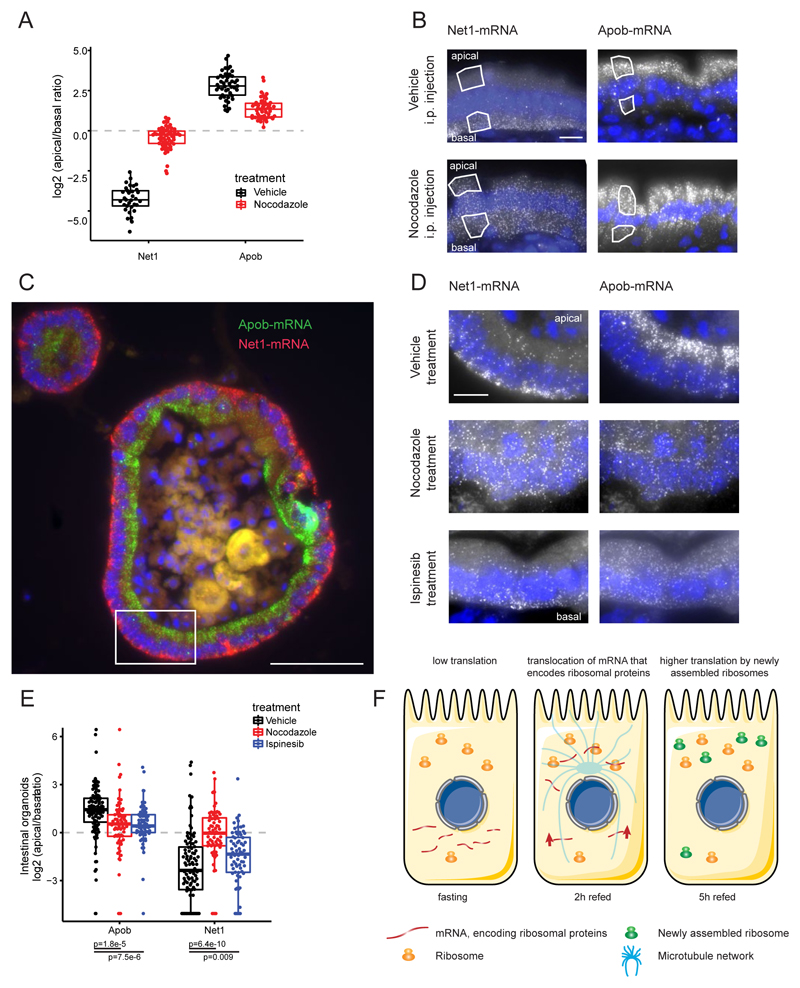
Asymmetric messenger RNA (mRNA) localization facilitates efficient translation in cells such as neurons and fibroblasts. However, the extent and importance of mRNA polarization in epithelial tissues are unclear. Here, we used single-molecule transcript imaging and subcellular transcriptomics to uncover global apical-basal intracellular polarization of mRNA in the mouse intestinal epithelium. The localization of mRNAs did not generally overlap protein localization. Instead, ribosomes were more abundant on the apical sides, and apical transcripts were consequently more efficiently translated. Refeeding of fasted mice elicited a basal-to-apical shift in polarization of mRNAs encoding ribosomal proteins, which was associated with a specific boost in their translation. This led to increased protein production, required for efficient nutrient absorption. These findings reveal a posttranscriptional regulatory mechanism involving dynamic polarization of mRNA and polarized translation.


Figures

Fig. 1
Fig. 1. Global analysis of mRNA polarization in the intestinal epithelium.
(A) Laser capture microdissection of paired apical and basal fragments. (B) RNA-seq data of isolated subcellular areas. Insets show smFISH validation results of transcripts of interest. Four outlier data points are omitted from the plot. Of the transcripts, 645 of 9905 are significantly apical and 779 of 9905 are significantly basal. Dashed vertical line separates the 2000 most highly expressed transcripts, of which 392 genes are significantly apical and 194 are significantly basal. (C) smFISH staining of the apical Apob (red) and basal Cyb5r3 (green) mRNA. (D) Strong correlation of smFISH quantifications and RNAseq data for 14 representative genes (Spearman’s r = 0.97, P < 2.2 × 10⁻¹⁶); dots and error bars represent median and 95% confidence interval of smFISH and mean and SE of RNAseq. All scale bars are 10 μm.
Fig. 2
Fig. 2. Translational machinery is asymmetrically distributed.
(A) Ranking of gene sets that are significantly enriched on the apical cell sides. (B) Costaining of the discordantly localized basolateral protein E-cadherin, encoded by Cdh1 (gray staining) and its apically localized mRNA (green dots). (C) Mass spectrometry results of microdissected areas demonstrate apical enrichment of ribosomal proteins and a lack of positive correlation (Spearman’s r = –0.12, P = 8 × 10⁻⁴). Blue, all genes; red, genes with GO-Ribosome annotation. (D) Representative smFISH staining and quantification of intracellular distribution of rRNA 18S and 28S (n = 142 single cells, P < 2.2 × 10⁻¹⁶). (E) Representative staining and quantification of nascent proteins (n = 143 single cells, P < 2.2 × 10⁻¹⁶). (F) Normalized coverage plot of ribosome footprint sequencing data (n = 3 mice, gray area denotes SD). (G) TE increases with the apical bias of genes in fasting mouse samples. The y axis shows the mean TE over a sliding window of 1000 genes consecutively shifted from the most basal gene to the most apical gene, with a 500-gene overlap. The x axis is the mean apical bias of genes within each window. Patches are standard errors of the mean. (H) Translational efficiency of the significantly localized transcripts (false discovery rate adjusted P value <0.1, n apical = 346, n basal = 141, P = 8.4 × 10⁻¹⁰; 20 outlier data points are omitted from the plot). Data include only genes for which we obtained TE values and that are of epithelial origin (methods). All scale bars are 10 μm.
Fig. 3
Fig. 3. Dynamic shifts of localized transcripts are associated with differential translational efficiency.
(A) Scatterplot of TE and mRNA localization changes when comparing three fasting and three refed mice (n = 6282 transcripts). The x axis is log2 of the ratios between TEs in refed and in fasting states; the y axis is log2 of the ratios of apical biases between refed and fasting states, where apical bias for each condition is the ratio of apical and basal TPM (methods). Upon refeeding, mRNAs encoding ribosomal proteins (red dots) become more apically polarized and are translated more efficiently. (B) smFISH images of Rpl3 and Rpl4 mRNA across metabolic states. (C) Quantification of Rpl3 and Rpl4 smFISH analyses across metabolic states (n = 70 single cells, Rpl3 P = 1.8 × 10⁻⁸, Rpl4 P = 2.9 × 10⁻¹³). (D) Comparison of nascent protein content at fasting and 5-hour refeeding time point (n = 188 single cells, P < 2.2 × 10⁻¹⁶). All scale bars are 10 μm.
Fig. 4
Fig. 4. Intestinal mRNA localization is mediated by the microtubule network.
(A) Nocodazole strongly perturbs the polarization of Net1 and Apob (Net1 n = 94 cells, P = 1.1 × 10⁻¹⁵, Apob n = 96 cells, P = 2.9 × 10⁻¹²). (B) Representative smFISH images of strongly polar Net1 and Apob transcripts in vehicle- or nocodazole-injected animals. Scale bar, 10 μm. (C) Intracellular mRNA localization of Net1 and Apob in intestinal organoids phenocopies in vivo observations. Highlighted inset is shown in higher magnification in top row of (D). Scale bar, 50 μm. (D) smFISH images of Net1 and Apob in nocodazole-, ispinesib-, or vehicle-treated organoids. Scale bar, 10 μm. (E) Single-cell quantification of the nocodazole and ispinesib effects on transcript localization in smFISH images of intestinal organoids (vehicle n = 101, ispinesib n = 68, nocodazole n = 77 cells, costaining of Apob and Net1). (F) Transcripts that encode ribosomal proteins are stored in the less translationally active basal side of the intestinal epithelium in fasting mice. Refeeding induces a translocation of these transcripts into the more translationally active apical cell side. This translocation is associated with a concomitant increase in their translational efficiency. The increased ribosomal biogenesis is reflected in an increased total protein synthesis.

Comment in

  • mRNAs on the Move after Lunch.
    Lasko P. Lasko P. Dev Cell. 2017 Sep 11;42(5):439-440. doi: 10.1016/j.devcel.2017.08.017. Dev Cell. 2017. PMID: 28898674
  • RNA localization feeds translation.
    Gáspár I, Ephrussi A. Gáspár I, et al. Science. 2017 Sep 22;357(6357):1235-1236. doi: 10.1126/science.aao5796. Science. 2017. PMID: 28935790 No abstract available.

References

    1. Buxbaum AR, Haimovich G, Singer RH. In the right place at the right time: Visualizing and understanding mRNA localization. Nat Rev Mol Cell Biol. 2015;16:95–109. doi: 10.1038/nrm3918. - DOI - PMC - PubMed
    1. Holt CE, Bullock SL. Subcellular mRNA localization in animal cells and why it matters. Science. 2009;326:1212–1216. doi: 10.1126/science.1176488. - DOI - PMC - PubMed
    1. Martin KC, Ephrussi A. mRNA localization: Gene expression in the spatial dimension. Cell. 2009;136:719–730. doi: 10.1016/j.cell.2009.01.044. - DOI - PMC - PubMed
    1. Lécuyer E, et al. Global analysis of mrna localization reveals a prominent role in organizing cellular architecture and function. Cell. 2007;131:174–187. - PubMed
    1. Mili S, Moissoglu K, Macara IG. Genome-wide screen reveals APC-associated RNAs enriched in cell protrusions. Nature. 2008;453:115–119. - PMC - PubMed

Publication types