. 2017 Aug 11;357(6351):564-569.
doi: 10.1126/science.aal2674.

Eye patches: Protein assembly of index-gradient squid lenses

Affiliations

Eye patches: Protein assembly of index-gradient squid lenses

J Cai et al. Science. .

Abstract

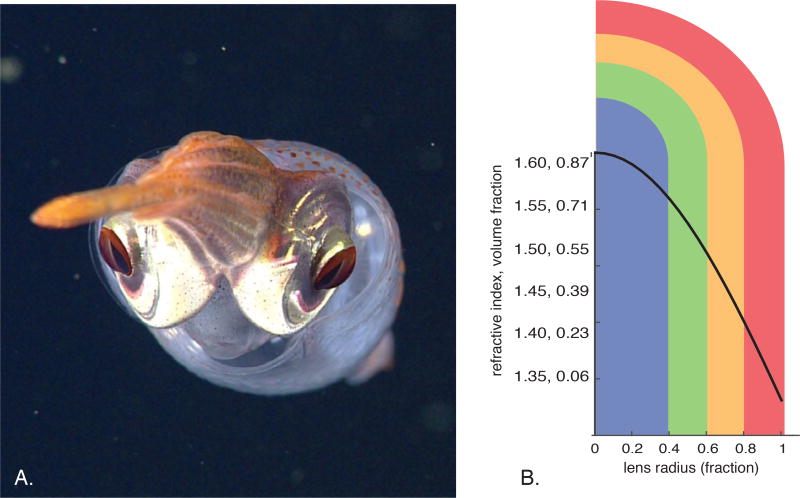
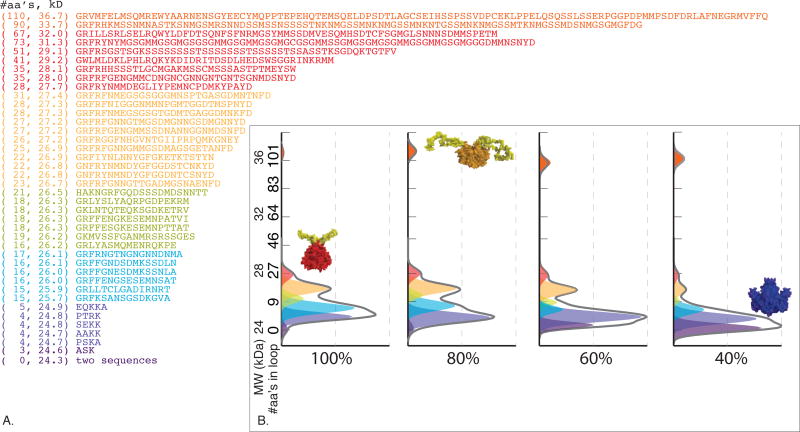
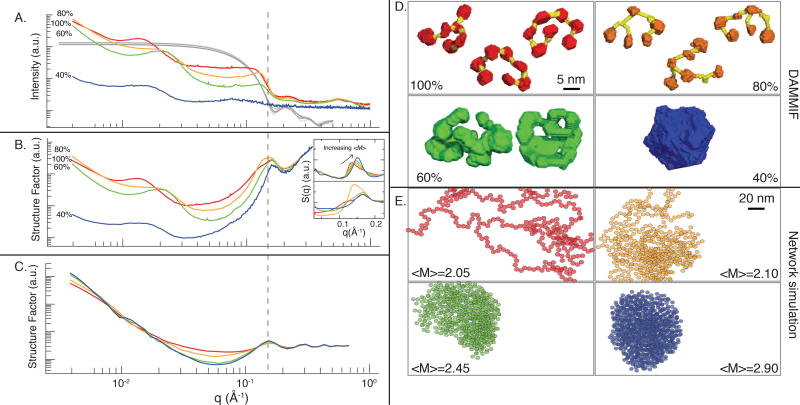
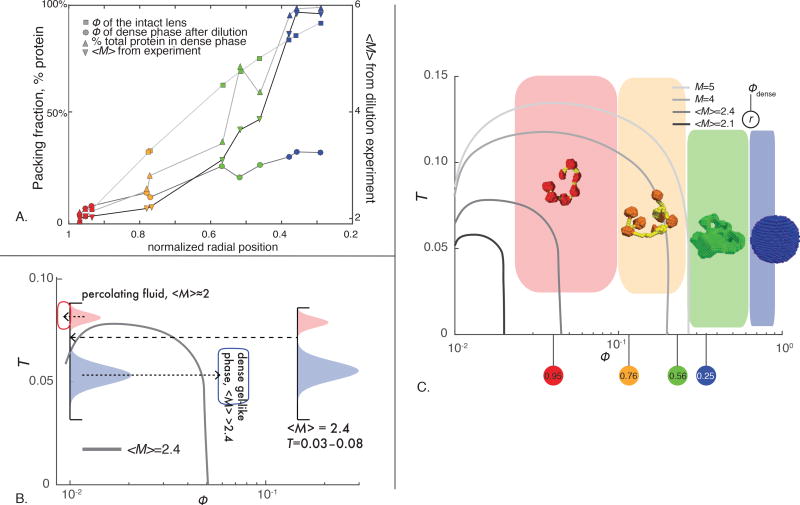
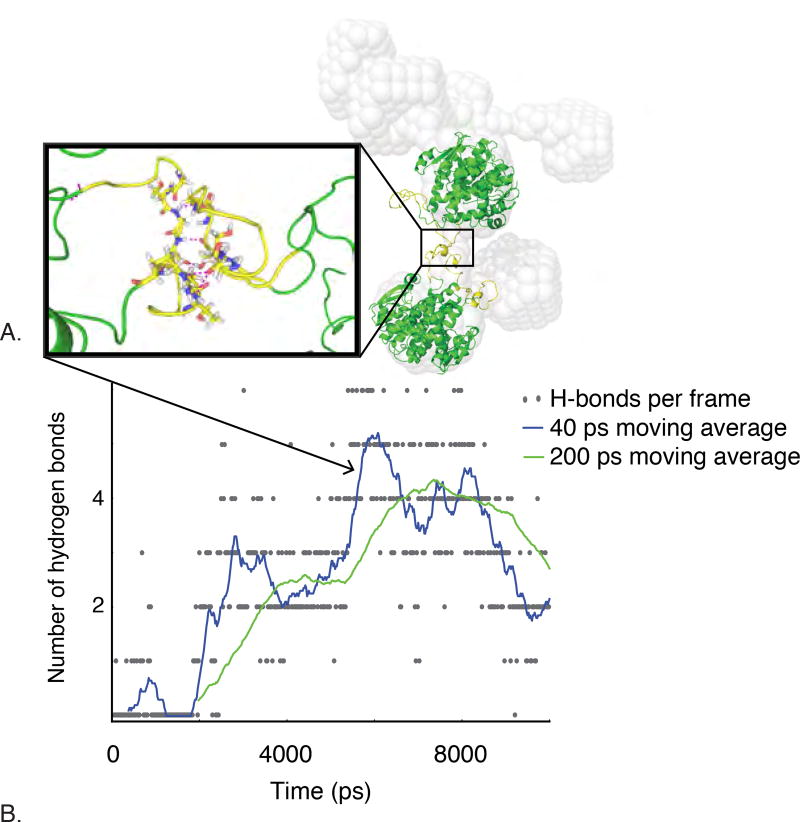
A parabolic relationship between lens radius and refractive index allows spherical lenses to avoid spherical aberration. We show that in squid, patchy colloidal physics resulted from an evolutionary radiation of globular S-crystallin proteins. Small-angle x-ray scattering experiments on lens tissue show colloidal gels of S-crystallins at all radial positions. Sparse lens materials form via low-valence linkages between disordered loops protruding from the protein surface. The loops are polydisperse and bind via a set of hydrogen bonds between disordered side chains. Peripheral lens regions with low particle valence form stable, volume-spanning gels at low density, whereas central regions with higher average valence gel at higher densities. The proteins demonstrate an evolved set of linkers for self-assembly of nanoparticles into volumetric materials.


Figures

Figure 1
Figure 1
Relationships between lens radius, refractive index, protein structure and network structure. A) In situ photograph of a decapod squid showing spherical, gradient index lenses. B) Lens radius vs. refractive index, with an overlay showing the relationship between lens radius and the color-coding used in this work to identify discretized tissue samples (blue for r<40%, green for 40%<r<60%, orange for radii 60%<r<80% and red for r>80%.
Figure 2
Figure 2
“Loop” sequences and their estimated relative abundance as a function of lens radius. A) Unique “loop”-encoding sequences as determined by lens RNA sequencing, and the relative abundance of proteins of different molecular weights. Parentheses show number of amino acids in the sequence and its molecular weight in kilodaltons. Sequence text is colored to correspond to peak decomposition in (B). B) SDS-PAGE of lens samples taken from different radial positions of the lens, and an estimated abundance of components of different loop molecular weights. The grey curve shows both the raw SDS-PAGE staining density and the sum of the curves in the fit (the two are similar to within the width of the line). The colored regions show the estimated abundance of a molecular weight component within a given sample. Images of protein show the predicted homology model structure of an S-crystallin in a given molecular weight class (long loops in red, short loops in blue, and 100-aa loops in orange).
Figure 3
Figure 3
SAXS, DAMMIF structures, and modeled networks of particles. <M> is the average protein coordination number. A) X-ray scattering intensity as a function of q, (I(q)). Measurements from different radial portions of the lens are indicated by color. Gray traces show the calculated form factor of isolated S-crystallin dimers. B) Structure factors of different concentric regions of the lens, calculated using I(q) and the calculated form factor shown in (A). Inset of (B): Peak position associated with particle pair-wise interactions in numerical simulation (top panel, data from [22])) and experimentally measured in this study (bottom panel). The peak associated with pairwise interactions moves toward lower q as <M> increases when Φ is held constant. C) Structure factors of simulated branching networks of particles with coordinate numbers predicted to exist in the squid lens. D) Sample of DAMMIF predictions of lens material structure, calculated using the SAXS data in (A), coordination number. Scale bar applies to all panels of (D). Individual S-crystallins are colored according to radial position while predicted links between S-crystallins are colored yellow. E) Sample of structures from network simulations, whose structure factors are shown in (C). Scale bar applies to all panels of (E). 10,000 particles were included in the calculation of structure factor; a few hundred particles from each simulation are shown here, in a box of the same volume for each simulation.
Figure 4
Figure 4
Experimental data mapped to patchy colloid theory A) Volume fraction (Φ) of the intact lens, of the dense material after dilution, percent total protein in the dense state, and calculated <M> resulting from this experiment as a function of lens radius. Each symbol represents one measurement and three lenses were sampled for each curve. B) Schematic showing how a polydisperse set of effective bond temperatures in a patchy colloidal system, when diluted, will phase separate. Vertical line indicates the likely range of effective bond temperatures (T) in a given mixture in the lens, and the filled red and blue shapes indicate a possible set of “high” and "low" effective temperature bonds in the system. Arrows indicate how “high temperature” particles in the system will re-equilibrate into a percolating fluid, while “low temperature” particles are in an unstable part of the diagram and re-equilibrate in to a dense material. C) Experimental data for the lens system plotted in context of patchy colloid theory. Likely bond temperatures for the system are shown in the height of the colored squares, while the density spanned by each experimentally characterized layer is shown in the width. Spinodal lines from theory (11) are shown in shades of grey. Circles underneath the x-axis indicate the densities of the dense material generated dilution, the radius from which samples were taken is shown inside.
Figure 5
Figure 5
MD simulation of patch-like loop-loop interaction in low-index regions of the lens. A) Homology models of S-crystallin dimers, shown in green and yellow, with centers of mass positioned according to DAMMIF output, shown in grey. Inset shows the interaction of the two unstructured loops of proteins in this orientation after ~6,000 ps of MD simulation. Hydrogen bonds between the two loops are shown in pink. B) Number of hydrogen bonds between two loops binding together two separate S-crystallin dimers in MD simulation as a function of time. Hydrogen bonds form between the two loops after a few hundred ps and increase to a maximum of six, with a 200-ps moving average of four.

Comment in

  • Patchy proteins form a perfect lens.
    Madl T. Madl T. Science. 2017 Aug 11;357(6351):546-547. doi: 10.1126/science.aao1456. Science. 2017. PMID: 28798115 Free PMC article. No abstract available.

References

    1. Maxwell JC. Solutions of problems. Camb. Dublin Math J. 1854;8:188.
    1. Packard A. Cephalopods and fish: The limits of convergence. Biol. Rev. Biol. Proc. Cambridge Philos. Soc. 1972;47:241–307.
    1. Land MF, Nilsson DE. Animal eyes. Oxford University Press; 2012.
    1. Malfois M, Bonneté F, Belloni L, Tardieu A. A model of attractive interactions to account for fluid–fluid phase separation of protein solutions. J. Chem. Phys. 1996;105:3290–3300.
    1. Benedek GB. Theory of transparency of the eye. Appl. Opt. 1971;10:459–473. - PubMed

Publication types

LinkOut - more resources