

Review
doi: 10.1085/jgp.201711809.
Epub 2017 Aug 10.
The intricacies of atrial calcium cycling during excitation-contraction coupling
Affiliations
- PMID: 28798277
- PMCID: PMC5583713
- DOI: 10.1085/jgp.201711809
Item in Clipboard
Review
The intricacies of atrial calcium cycling during excitation-contraction coupling
J Gen Physiol.
.
Abstract
Blatter discusses the initiation and spread of Ca release, Ca store depletion, and release termination in atrial myocytes.
Figures
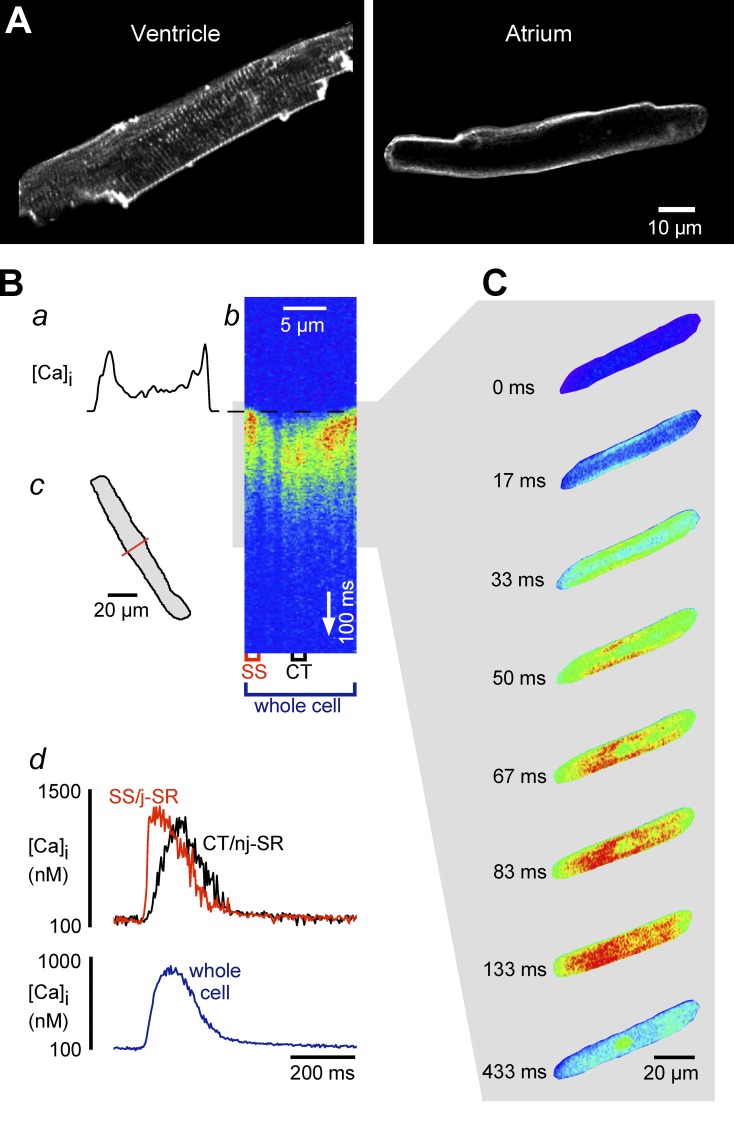
Ca signaling during ECC in atrial myocytes. (A) Transverse tubule staining in ventricular and atrial myocytes with the membrane-bound fluorescent dye Di-8-ANEPPS. (B) Transverse (c) confocal line scan image of an atrial AP-induced CaT. Electrical stimulation triggered a "U"-shaped CaT (b), indicating that [Ca]i increased first at the cell periphery (a) before propagating toward the center of the myocyte. (d) Local CaTs (top) originating from subsarcolemmal (SS) j-SR and central (CT) nj-SR regions and the Ca signal averaged over the entire width of the cell (bottom). (C) Spatiotemporal pattern of an AP-induced atrial CaT visualized by two-dimensional confocal microscopy. Reproduced from Blatter et al. (2003).

Intra-SR Ca sensitization signal during atrial ECC. (A) [Ca]i (rhod-2) and [Ca]SR (fluo-5N) fluorescence signals (F/F0; averaged over 0.6-µm-wide regions of interest) elicited by AP depolarization and recorded from individual peripheral (a) and central (b) release sites in a ventricular myocyte. The dashed vertical line marks the simultaneous onset of the cytosolic CaT and SR depletion in both subcellular regions. (B) [Ca]i and [Ca]SR signals recorded from an atrial cell. In the cell periphery (a), the rise of [Ca]i and [Ca]SR decline is simultaneous (vertical dashed line 1). In the cell center (b), the rise of [Ca]i is delayed, and [Ca]SR depletion lags behind the rise of [Ca]i. The decline of [Ca]SR is preceded by the Ca sensitization signal, a transient elevation of [Ca]SR (arrow). Vertical dashed lines 2 and 3 mark the duration of the Ca sensitization signal, and the time interval 1–3 is defined as latency. Reproduced from Maxwell and Blatter (2017).

Atrial ECC: tandem RyR activation and FDUF mechanism. AP-induced Ca release from j-SR by LCC activation (1), followed by propagation through mitochondria-free transition zone (TZ; 2) and activation of centripetal propagating CICR (3) from central (CT) nj-SR CRUs (CT1→CT2→CT3→…). Inset: FDUF mechanism. Tandem RyR activation by cytosolic CICR (A) and luminal RyR sensitization (B) by elevated [Ca]SR (SR Ca sensitization signal) resulting in Ca release (C). SR Ca sensitization signal is generated by Ca uptake at the activation front by SERCA. Reproduced from Maxwell and Blatter (2017).

Cytosolic and Ca depletion signals from j-SR and nj-SR. (A) [Ca]i and [Ca]SR changes elicited by AP depolarization from subsarcolemmal (SS) j-SR and central (CT) nj-SR in an atrial myocyte (inset). (B) Mean cytosolic CaT and SR Ca depletion amplitudes of AP-induced Ca release from j-SR and nj-SR. *, P < 0.001. (C) Cytosolic CaT and SR Ca depletion amplitudes along a transverse line showing Ca signals in the SS and transition zone (TZ) between j-SR and nj-SR regions, as well as from CT nj-SR release sites at increasing cell depth (CT1…CT6). Distance between measurements is 1 µm. (D) Averaged confocal lines scan images (F/F0) of Ca sparks and corresponding Ca blinks originating from SS j-SR and CT nj-SR. (E) Mean Ca spark and blink profiles (F/F0) from images in D. Reproduced from Maxwell and Blatter (2017).
References
-
- Berlin J.R. 1995. Spatiotemporal changes of Ca2+ during electrically evoked contractions in atrial and ventricular cells. Am. J. Physiol. 269:H1165–H1170. - PubMed
Publication types
MeSH terms
Grants and funding
LinkOut - more resources
Full Text Sources
Other Literature Sources
