. 2017 Aug 10;7(1):7715.
doi: 10.1038/s41598-017-07851-z.

Luciferase Expression Allows Bioluminescence Imaging But Imposes Limitations on the Orthotopic Mouse (4T1) Model of Breast Cancer

Affiliations

Luciferase Expression Allows Bioluminescence Imaging But Imposes Limitations on the Orthotopic Mouse (4T1) Model of Breast Cancer

V P Baklaushev et al. Sci Rep. .

Abstract

Implantation of reporter-labeled tumor cells in an immunocompetent host involves a risk of their immune elimination. We have studied this effect in a mouse model of breast cancer after the orthotopic implantation of mammary gland adenocarcinoma 4T1 cells genetically labelled with luciferase (Luc). Mice were implanted with 4T1 cells and two derivative Luc-expressing clones 4T1luc2 and 4T1luc2D6 exhibiting equal in vitro growth rates. In vivo, the daughter 4T1luc2 clone exhibited nearly the same, and 4T1luc2D6, a lower growth rate than the parental cells. The metastatic potential of 4T1 variants was assessed by magnetic resonance, bioluminescent imaging, micro-computed tomography, and densitometry which detected 100-μm metastases in multiple organs and bones at the early stage of their development. After 3-4 weeks, 4T1 generated 11.4 ± 2.1, 4T1luc2D6, 4.5 ± 0.6; and 4T1luc2, <1 metastases per mouse, locations restricted to lungs and regional lymph nodes. Mice bearing Luc-expressing tumors developed IFN-γ response to the dominant CTL epitope of Luc. Induced by intradermal DNA-immunization, such response protected mice from the establishment of 4T1luc2-tumors. Our data show that natural or induced cellular response against the reporter restricts growth and metastatic activity of the reporter-labelled tumor cells. Such cells represent a powerful instrument for improving immunization technique for cancer vaccine applications.


Conflict of interest statement

The authors declare that they have no competing interests.

Figures

Figure 1
Figure 1
Growth rates of the murine adenocarcinoma 4T1 cell line and its sublclones expressing luciferase 4T1luc2D6 and 4T1luc2. The time course of the proliferation of the parental 4T1, and 4T1luc2D6 and 4T1luc2 (PerkinElmer) clones as determined using Nikon Biostation CT (Nikon, Japan) with STDV (A); Bioluminescence from 4T1luc2 and 4T1luc2D6 cells in culture assessed by bioluminescent imaging (Spectrum CT, Perkin Elmer) (B); Average level of bioluminescence of 4T1luc2 and 4T1luc2D6 cells (photons/cell/sec) (C). Results from five independent measurements. No significant difference between any of the analysed parameters (p > 0,05; Mann Whitney test).
Figure 2
Figure 2
Growth in BALB/c mice (n = 5–6 per group) of primary tumors induced by the implantation of 4T1, 4T1luc2 and 4T1lucD6 cells (see Methods for description). Growth curves obtained by MRI visualize average tumor volume in cubic mm, with STDV (A); Growth of primary tumors induced by implantation of 4T1luc2 and 4T1lucD6 cells monitored by bioluminescent imaging; curves depict an average photon flux from the tumor per sec, with STDV (B); Statistical comparison of the tumor sizes evaluated by MRI (C). Median size of 4T1lucD6 tumors is significantly lower (p = 0,017), and of 4T1luc2 tumors tend to be lower than of 4T1 tumors, although the difference is not significant (p = 0,17). Day of implantation is counted as day 0. Statistical comparisons are done using Kruskal Wallis and Mann-Whitney tests (Statistica AXA 10.0).
Figure 3
Figure 3
Comparison of the luciferase activity measured as the intensity of luminescence (in arbitrary units a.u.; Enspire, Perkin Elmer) in the original 4T1luc2 and 4T1luc2D6 cell lines and in cell cultures prepared from the 4T1luc2 and 4T1luc2D6 tumors by the experimental end-point. Luciferase activity in the 4T1luc2 and 4T1luc2D6 cells prior to implantation (A); Luciferase activity in primary cell cultures prepared from tumors formed in BALB/c mice by implantation of 4T1luc2D6 (n = 3; 6 tumors) (B) or 4T1luc2 cells (n = 3; 6 tumors) (C); Recalculation of the average luciferase activity per cell with STDV (D). Individual tumors are coded by the cell line, mouse and tumor numbers, for example “4T1luc2D6 n10 r1” designate a tumor caused by implantation of cell line 4T1luc2D6 into mouse No. 10 and refer to sample No. 1 from one of the tumors. Curves in panels B and D show dependence of luciferase activity on the number of cells used in the assay; data represent the average of three parallel measurements. Statistical comparisons are done using Mann-Whitney test (Statistica AXA 10.0); **p < 0,01, and *p < 0,05.
Figure 4
Figure 4
Multiple metastases in BALB/c mice after the orthotopic implantation of 4T1 (AD) or 4T1luc2D6 cells (EH) as visualized by the T2-weighted MRI. 4T1 metastasis in lungs, the lower arrow indicates the metastasis in a lymph node, transversal projection (A); Multiple metastatic lesions of the 4T1 primary tumor into the posterior cervical lymph nodes (indicated by arrows), sagittal projection (B); Metastatic lesions induced by 4T1 cells in the brain (indicated by arrow) in coronary projections, metastases are manifested by massive perifocal edema (C,D); Metastases of 4T1luc2D6 tumor in the retroperitoneal and paravertebral regions, transversal projections (E and F, respectively); Single metastasis of the 4T1luc2D6 tumor in the lung, coronary projection (G); Metastases of the 4T1luc2D6 tumor in the spleen (indicated by arrows), sagittal projection (H).
Figure 5
Figure 5
Characteristics of the metastatic potential of Luc-expressing 4T1 cells in the orthotopic breast cancer model evaluated by BLI and confirmed by MRI. Small metastases of 4T1luc2D6 cells in the lungs and soft tissues one week after removal of the primary focus (week 4 after the implantation of 4T1lucD6 cells) visualized by micro-CT, 3D BLI (A,B), and verified by histochemistry (C,D,E,F). Metastasis as a single source of luminescence are detectable in the lung and neck (A), and in the lung and muscle tissues of the lower right foreleg (B), panels I, II, III demonstrate microCT xy-, yz-, and zx- projections respectively, and panel IV, 3D reconstruction of microCT and BLI (A,B); Histological verification of the multiple 200–500 μm metastasis in lungs (C,D), and muscle tissues (E,F); Metastases in muscle tissue, 300 × 600 μm in size, detected by bioluminescence imaging (E). Hematoxylin-eosin staining of sections of paraffin-block preparations of the lung metastases (C,D) and metastases in muscle tissue (E,F) demonstrated hypercellular foci consisting of the polymorphic cells characteristic of the high-grade carcinomas. Magnification 50× (C,E) and 200× (D,F); scale bar 50 μm.
Figure 6
Figure 6
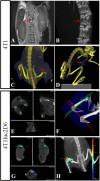
Bone metastases formed by 4T1 (AD) and 4T1luc2D6 (EH) tumors at week 4 after implantation visualized by the combination of MRI, micro-CT and optical imaging. The T2-weighted MRI of a mouse with a 4T1 carcinoma, coronary section, the arrow indicates a metastasis in the vertebral body (A); Targeted high-resolution micro-CT of the same mouse with a fragment of 3D reconstruction, the arrow indicates the focus of osteolysis of the vertebral body (B); Micro-CT of a mouse with a 4T1 carcinoma on day 28 after implantation, the arrow indicates a osteolytic lesion by metastasis of the distal epiphysis of the right femur (C); Micro-CT of a 4T1 mouse with a metastasis in the region of the right knee-joint, the areas subjected to densitometry are highlighted (D); Targeted micro-CT of a 4T1luc2D6 mouse, the arrow indicates the metastasis in the distal epiphysis of the right femur (E,F); 4T1luc2D6 metastasis in the vertebral body (G) and the lower third of the left femur (H) visualized by bioluminescent imaging.
Figure 7
Figure 7
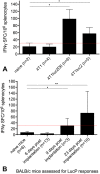
In vitro IFN-gamma response of lymphocytes of BALB/c mice implanted with Luc-expressing 4T1luc2D6 or 4Tl1luc2, or parental 4T1 cells, to stimulation with peptide GFQSMYTFV representing an immunodominant CTL epitope of luciferase (LucP) assessed using IFN-γ ELISpot (Mabtech). IFN-γ response to LucP by the experimental end-point assessed as the average number of IFN-γ spot forming cells per mln splenocytes (SFC/mln) with STDV; *p < 0.05, IFN-γ response to LucP in BALB/c mice implanted with 4T1luc2D6 and 4T1luc2 cells compared to IFN-γ response exhibited by naïve or 4T1-implanted mice (Mann-Whitney test) (A); Development of cellular immune response to LucP in mice implanted with 5000 4T1luc2 cells, on days 6, 9 and 23 post implantation; *p < 0.05, IFN-γ response to LucP in BALB/c mice implanted with 4T1luc2 cells on days 9 and 23 post implantation compared to IFN-γ response exhibited by naïve mice or mice implanted by 4T1luc2 and assessed on day 6 post implantation (Friedman ANOVA and Kendall Coeff. of Concordance) (B). Red line indicates the cut-off for the specific IFN-γ response, defined as an average number of lymphocytes producing IFN-γ in response to stimulation with LucP ± 3 STDV per mln lymphocytes. Cut-off was established in independent in vitro tests done on splenocytes of naïve mice (n = 5).
Figure 8
Figure 8
Intradermal Luc DNA immunization followed by electroporation (EP) with driving pulses of 100 V makes BALB/c mice resistant to initiation of 4T1luc2 tumors. BALB/c mice were immunized by plasmid encoding firefly luciferase pVaxLuc delivered by intradermal injections followed by EP using multineedle (Mn) electrodes mounted on Dermavax (Cellectis) (n = 4) or CUY21EditII (BEX Ltd) electroporators at 100 V (n = 6) or 50 V (n = 4). Immunization (red circles) and 4T1luc2 implantation sites (blue circles) visualized by in vivo imaging (Spectrum CT) on days 1 and 6 post tumor cell implantation (43 and 48 days of the immunization cycle). Mice immunized with Luc DNA (A, upper panel) versus empty vector (A, lower panel). Text boxes demonstrate total flux from the respective regions of interest (ROI) (photons/sec) (A); Quantification of bioluminescence emission (BLI; photon flux/sec) from immunization sites illustrates the efficacy of Luc gene transfer and expression. From day 5, Luc DNA immunized mice electroporated at 100 V emitted stronger bioluminescence than mice electroporated at 50 V (p < 0,05; Mann Whitney test), no bioluminescence from immunization sites in control mice receiving pVax1 (B); Quantification of bioluminescence (photon flux/sec) from 4T1luc2 implantation sites in mice immunized with Luc DNA and electroporated with DermaVax/Mn at 100 V (n = 4), BEX/Mn at 100 V (n = 6), BEX/Mn at 50 V (n = 4), and vector immunized mice (n = 3) on days 0 to 6 post challenge (C); Difference (in %) in BLI from 4T1luc2 implantation sites after six days of tumor growth in mice immunized with Luc DNA with EP at 100 V (DermaVax/Mn + BEX/Mn groups, 10 animals, dubbed “Luc, 100 V”), or 50 V (BEX/Mn, 4 animals, dubbed “Luc, 50 V”), vector immunized (n = 3) and naive mice (n = 5, from an independent experiment) (D). *p < 0,05; **p < 0,1 (Statistica AXA 10.0).
Figure 9
Figure 9
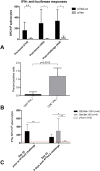
Cellular immune response to peptide GFQSMYTFV representing an immunodominant CTL epitope of luciferase (LucP; ref. 21) in mice immunized with Luc DNA (pVaxLuc). The average number of IFN-γ producing splenocytes per mln cells in mice receiving pVaxLuc followed by electroporation using Dermavax (n = 6), or BEX devices at 100 V (n = 6), or empty vector pVax1 with electroporation using BEX device at 100 V (n = 6) after priming (day 21), boosting (day 30), and after challenge with 4T1luc2 cells (day 9, or 43 from the start) (see Methods for details) (A); FACS of the pooled splenocytes of Luc-gene immunized mice detecting LucP-specific secretion of IFN-γ by CD8 + T cells (B); Average LucP-specific IFN-γ response of mice immunized with Luc DNA and electroporated using CUY21EditII (BEX) at 50 V and 100 V (C). Red line indicates the cut-off for specific IFN-γ response as number of spots registered in non-immune (control and vector immunized) mice + 3 STDV. *p < 0,05, Luc DNA immunized mice electroporated at 100 V, and **p < 0,1, Luc DNA immunized mice electroporated at 50 V compared to vector immunized mice (Mann-Whitney test; STATISTICA AXA 10.0).

References

    1. Donepudi MS, Kondapalli K, Amos SJ, Venkanteshan P. Breast cancer statistics and markers. J Cancer Res Ther. 2014;10(3):506–511. - PubMed
    1. Weigelt B, Peterse JL, van’t Veer LJ. Breast cancer metastasis: Markers and models. Nat Rev Cancer. 2005;5(8):591–602. doi: 10.1038/nrc1670. - DOI - PubMed
    1. Kiely D. Timeliness in breast cancer care as an indicator of quality. Clin J Oncol Nurs. 2014;18(1):82–88. doi: 10.1188/14.CJON.82-88. - DOI - PubMed
    1. Lelekakis M, et al. A novel orthotopic model of breast cancer metastasis to bone. Clin Exp Metastasis. 1999;17(2):163–170. doi: 10.1023/A:1006689719505. - DOI - PubMed
    1. Coleman RE, Smith P, Rubens RD. Clinical course and prognostic factors following bone recurrence from breast cancer. Br J Cancer. 1998;77(2):336–340. doi: 10.1038/bjc.1998.52. - DOI - PMC - PubMed

Publication types

MeSH terms