. 2017 Aug 10;7(1):7811.
doi: 10.1038/s41598-017-08166-9.

Isoflurane produces antidepressant effects and induces TrkB signaling in rodents

Affiliations

Isoflurane produces antidepressant effects and induces TrkB signaling in rodents

Hanna Antila et al. Sci Rep. .

Abstract

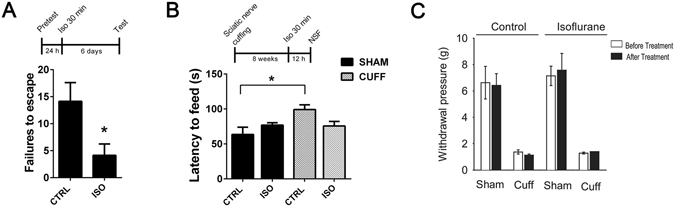
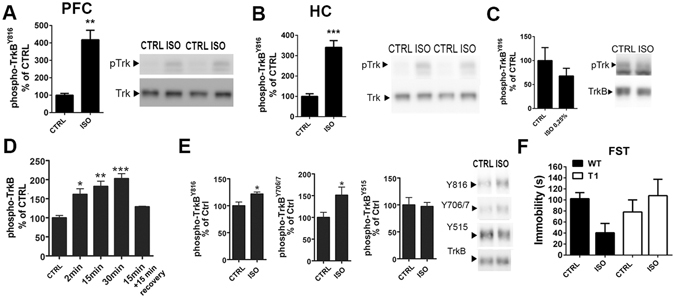
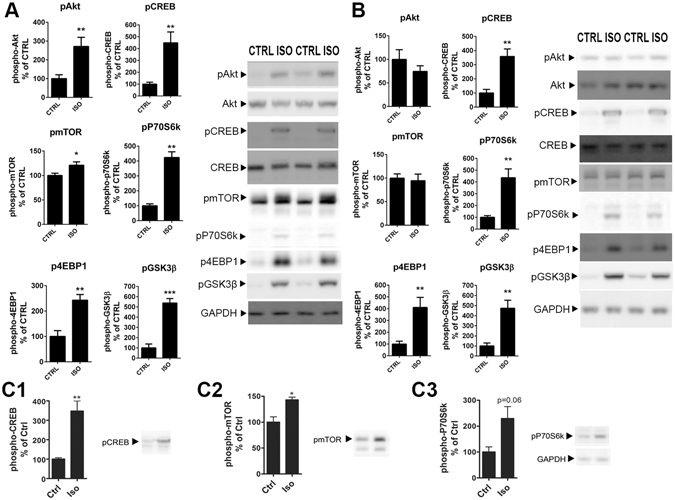
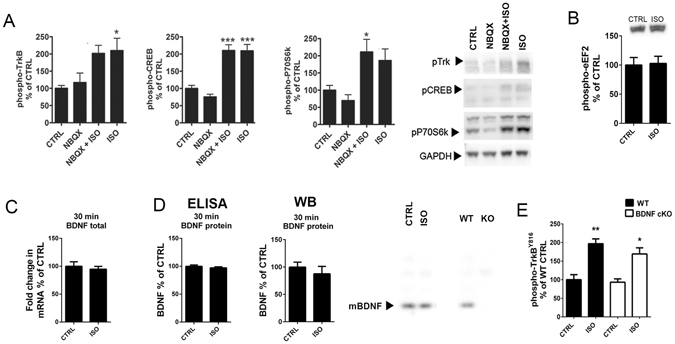
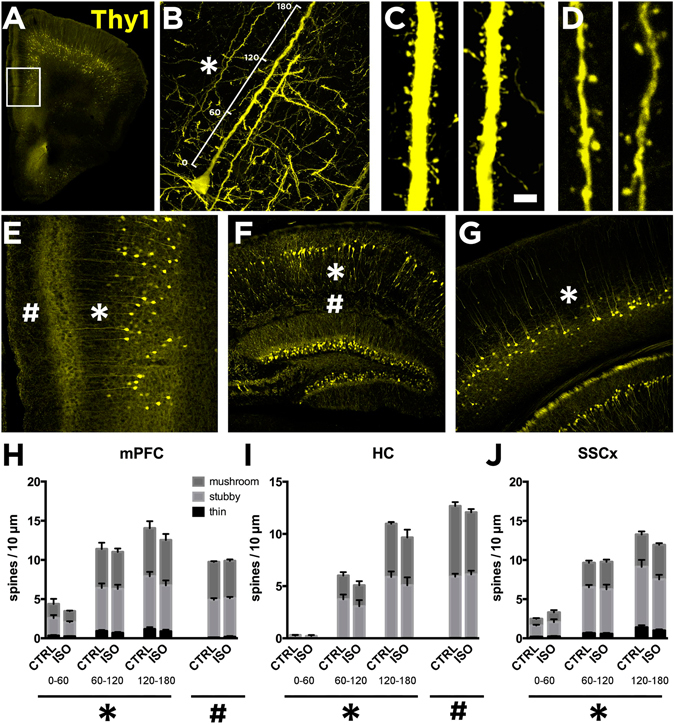
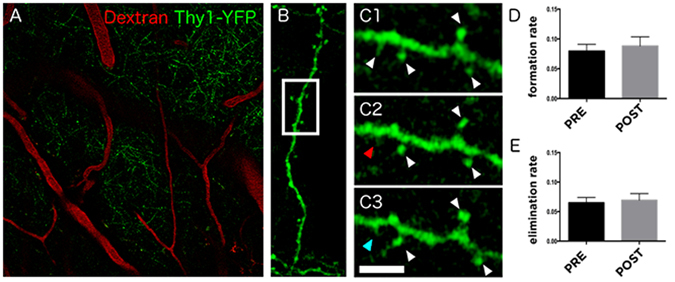
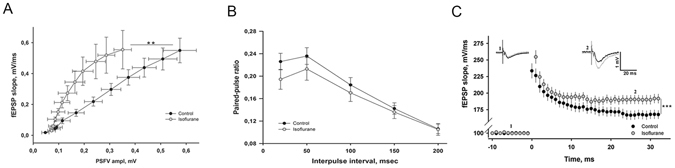
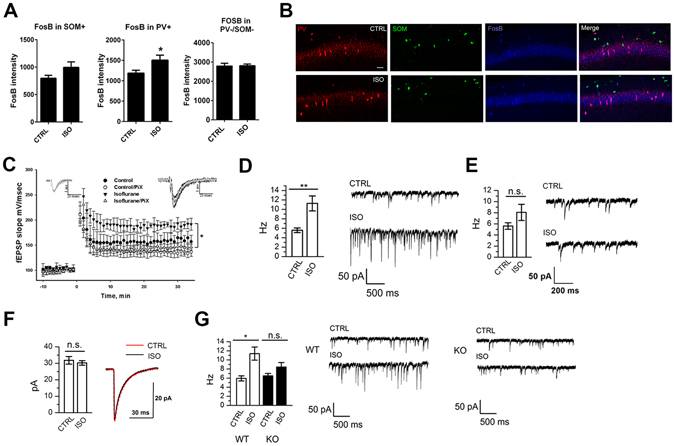
A brief burst-suppressing isoflurane anesthesia has been shown to rapidly alleviate symptoms of depression in a subset of patients, but the neurobiological basis of these observations remains obscure. We show that a single isoflurane anesthesia produces antidepressant-like behavioural effects in the learned helplessness paradigm and regulates molecular events implicated in the mechanism of action of rapid-acting antidepressant ketamine: activation of brain-derived neurotrophic factor (BDNF) receptor TrkB, facilitation of mammalian target of rapamycin (mTOR) signaling pathway and inhibition of glycogen synthase kinase 3β (GSK3β). Moreover, isoflurane affected neuronal plasticity by facilitating long-term potentiation in the hippocampus. We also found that isoflurane increased activity of the parvalbumin interneurons, and facilitated GABAergic transmission in wild type mice but not in transgenic mice with reduced TrkB expression in parvalbumin interneurons. Our findings strengthen the role of TrkB signaling in the antidepressant responses and encourage further evaluation of isoflurane as a rapid-acting antidepressant devoid of the psychotomimetic effects and abuse potential of ketamine.


Conflict of interest statement

L.K. is a paid employee in Neurotar Ltd.

Figures

Figure 1
Figure 1
A single brief isoflurane anesthesia produces antidepressant-like behavioural effects in rodents (A) A single isoflurane anesthesia (30 min) decreases the escape failures in the learned helplessness test when tested 6 days after the anesthesia (p = 0.0296; n = 7). (B) Mice subjected to right common sciatic nerve cuffing show anxiodepressive behaviour (increased latency to feed) in the novelty suppressed feeding test. Such phenotype is not seen in mice exposed to a single isoflurane anesthesia (30 min) at 12 hours before testing (two-way ANOVA: cuffing*treatment interaction F3,27 = 6,398, p = 0.018; nsham ctrl = 8, nsham iso = 8, ncuff ctrl = 8, ncuff iso = 7). (C) Control and isoflurane-treated mice subjected to the right sciatic nerve cuffing show essentially similar mechanical allodynia in the von Frey test 8-weeks post-surgery (Two-way ANOVA: surgery F1,24 = 123.19, p < 0.001, treatment F1,24 = 0.52, p = 0.47, surgery x treatment interaction F1,24 = 0.006, p = 0.93). The experiment was performed 3 days before and 2 days after control or isoflurane treatment. *p < 0.05, **p < 0.01; Statistical analysis was done using Student’s t test (A) or two-way ANOVA (B, C). Abbreviations: CTRL, control treatment; ISO, isoflurane treatment; Sham, sham surgery; Cuff, cuff surgery; NSF, novelty suppressed feeding test.
Figure 2
Figure 2
Isoflurane anesthesia induces TrkB autophosphorylation in the brain and produces antidepressant-like effects in the forced swim test. (A,B) Isoflurane anesthesia (30 min) increase phosphorylation of TrkBY816 in the adult mouse medial prefrontal cortex (p = 0.0022) and hippocampus (p < 0.0001). (C) Effect of subanesthetic isoflurane (0.3%, 15 min) on phosphorylation of TrkBY816 in the medial prefrontal cortex. (D) Time-dependent effect of isoflurane anesthesia on TrkB phosphorylation in the medial prefrontal cortex. (E) Significantly increased phosphorylation of the phospholipase-Cγ1 (PLCγ1) binding site (Y816) (p = 0.0182) and the catalytic domain (Y706/7) of TrkB (p = 0.0426) is detected after flag-immunoprecipitation from hippocampus of mice overexpressing flag-tagged full-length TrkB receptors in postnatal neurons. No change is detected in phosphorylation of Shc binding site (Y515) of TrkB (p = 0.8623). (F) Wild-type mice treated with isoflurane for 30 min show reduce immobility in the forced swim test when tested 15 minutes after the end of the treatment, whereas in the mice over-expressing the dominant-negative TrkB.T1 isoform the effect was absent (two-way ANOVA genotype*treatment interaction F3,24 = 4,301, p = 0.049, n = 7). pTrkB levels normalized to total TrkB (AD). Representative western blots (A,B,C,E) have been cropped from complete immunoblots shown in Supplementary Information file. *p < 0.05, **p < 0.01, ***p < 0.001; Mann Whitney U test, Student’s t test, one-way ANOVA followed by Dunnett’s post hoc test (C, all groups compared to the Ctrl) or two-way ANOVA followed by Tukey HSD post hoc test (E). Abbreviations: CTRL, control treatment; ISO, isoflurane treatment; FST, forced swim test; WT, wild-type; T1, mice overexpressing TrkB.T1; PFC, prefrontal cortex; HC, hippocampus.
Figure 3
Figure 3
Isoflurane anesthesia regulates intracellular signaling implicated in rapid antidepressant actions. (A) Phosphorylation of AktT308 (p = 0.0084), CREBS133 (p = 0.0087), mTORS2481 (p = 0.0292), p70S6KT421/S424 (p = 0.0022), 4-EBP1T37/46 (p = 0.0012) and GSK3βS9 (p = 0.0001) in the adult mouse prefrontal cortex after isoflurane anesthesia (30 min). (B) Phosphorylation of AktT308 (p = 0.3052), CREBS133 (p = 0.0014), mTORS2481 (p = 0.7422), p70S6KT421/S424 (p = 0.0022) 4E-BP1T37/46 (p = 0.0022) and GSK3βS9 (p = 0.0001) in the adult mouse hippocampus after isoflurane anesthesia (30 min). (C) Phosphorylation of CREBS133, mTORS2481 and p70S6KT421/S424 are increased within 2 minutes from the onset of isoflurane (4%) administration. pAKT and pCREB levels normalized to corresponding total protein, other phosphoproteins normalized to GAPDH. n = 6/group. Representative western blots have been cropped from complete immunoblots shown in Supplementary Information file. *p < 0.05, **p < 0.01, ***p < 0.001; Student’s t test. Abbreviations: CTRL, control treatment; ISO, isoflurane treatment; CREB, cAMP response element binding protein; Akt, protein kinase B; mTOR, mammalian target of rapamycin; GAPDH, glyceraldehyde 3-phosphate dehydrogenase, GSK3β, glycogen synthase kinase 3β.
Figure 4
Figure 4
Isoflurane transactivates TrkB. (A) Pre-treatment with the AMPA receptor blocker NBQX (10 mg/kg, i.p.) does not prevent isoflurane (15 min) induced phosphorylations of TrkB (two-way ANOVA: F3,20 = 4.379, p = 0.017; Tukey HSD post hoc test: CTRL vs. NBQX p = 0.972, CTRL vs. NBQX + ISO p = 0.075, CTRL vs. ISO p = 0.050, NBQX + ISO vs. ISO p = 0.996), CREB (two-way ANOVA: F3,20 = 24.731, p < 0.001; Tukey HSD post hoc test: CTRL vs. NBQX p = 0.648, CTRL vs. NBQX + ISO p < 0.001, CTRL vs. ISO p < 0.001, NBQX + ISO vs. ISO p = 1.000) or p70S6K (two-way ANOVA: F3,20 = 6.228, p = 0.0037; Tukey HSD post hoc test: CTRL vs. NBQX p = 0.859, CTRL vs. NBQX + ISO p = 0.041, CTRL vs. ISO p = 0.143, NBQX + ISO vs. ISO p = 0.916). pTrkB normalized to total TrkB, other phospho-proteins to GAPDH. n = 6/group. (B) The phosphorylation of eEF2 was not affected by isoflurane anesthesia (30 min) in the prefrontal cortex. n = 6. Student’s t test. (C) Total Bdnf mRNA (normalized to Gapdh mRNA) levels remain unaltered after isoflurane anesthesia (30 min) (nCtrl = 6; nIso = 5). (D) Mature BDNF protein levels remain unaltered after isoflurane anesthesia (30 min). Analysis done using ELISA and western blot. A representative western blot on right shows the mature BDNF band, which is absent in a sample obtained from conditional BDNF knockout (KO) mouse. (E) Isoflurane anesthesia activates TrkB in the hippocampus of conditional BDNF knockout mice (Two-way ANOVA treatment effect F3,12 = 41,843, p < 0.001; Tukey HSD post hoc test WT CTRL vs. WT ISO p = 0.001, WT CTRL vs. cKO ISO p = 0.015). Representative western blots (A, B, D) have been cropped from complete immunoblots shown in Supplementary Information file. *p < 0.05, **p < 0.01, ***p < 0.001; Abbreviations: CTRL, control treatment; ISO, isoflurane; AMPA, α-amino-3-hydroxy-5-methyl-4-isoxazolepropionic acid; NBQX, 2,3-dioxo-6-nitro-1,2,3,4-tetrahydrobenzo[f]quinoxaline-7-sulfonamide; CREB, cAMP response element binding protein; eEF2, Eukaryotic elongation factor 2.
Figure 5
Figure 5
Lack of effects of isoflurane anesthesia on dendritic spines in the mouse cortex and hippocampus. Reconstruction of confocal images showing the medial prefrontal cortex (mPFC) (A and E), the hippocampus (HC) (F) and somatosensory cortex (SSCx) (G) from Thy1-eYFP mice. We analyzed dendritic spine density of the primary apical dendrites of pyramidal neurons in three different segments of 60 µm each up to 180 µm from the cell soma (B; also indicated with *). Representative images of distal dendritic segment between 120 and 180 µm (C). We also analyzed extra-distal dendritic segments in the mPFC and the HC (D; indicated as # in E and F). We analyzed dendritic spine densities from mice subjected to sham or isoflurane treatment (30 min) 24-h before. Histograms showing the densities of spine subtypes in three different segments relative to the distance to the soma (B) in the mPFC (H; indicated as *), HC (I; *) and the SSCx (J; *). Isoflurane treatment did not produce changes to the spine morphology or to the total spine amount at different distances from the soma (2-way ANOVA: treatment effect for distance in the mPFC (F1,36 = 0.7705, p = 0.385), the HC (F1,21 = 1.371, p = 0.2547) and the SSCx (F1,36 = 0.02270, p = 0.8688)). Extra distal segments were also analyzed in the mPFC (H; indicated as #p = 0.6756) and the HC (I; #p = 0.8203). n = 7 mice/group, 3 sections/mouse, 8 dendrites/section. Scale bar in A and D: 4 μm. Statistical analysis was done using Student’s t test (for extra distal segments or # in H and I) and 2-way ANOVA (for the first 180 µm from the cell soma or * in H,I and J).
Figure 6
Figure 6
Effects of isoflurane on dendritic spine turnover in the somatosensory cortex of awake mice. (A) Focal plane showing expression of YFP under the thy1 promoter and the 70 kDa dextran tracer labeled with Texas Red which serves as map to identify the same areas during the different time points of the experiment. (B) Reconstruction of confocal images showing one of the dendritic segments analyzed. (C) Selected area shows a high magnification image of the dendrite to illustrate the spines (C1) 24 hours before, (C2) immediately before and (C3) 24 hours after the isoflurane administration (30 min). White arrowheads indicate stable spines, red arrowhead indicates eliminated spine and blue arrowhead indicates newly formed spine. Histograms represent (D) spine formation (p = 0.6476) and (E) elimination rate (p = 0.7301) before (pre-treatment) and after (post-treatment) isoflurane treatment. n = 3 mice, ~300 spines/mouse were analyzed. Scale bar size corresponds to 60 μm in A, 11.6 μm in B and 3.7 μm in C images. Statistical analysis was done using paired Student’s t test.
Figure 7
Figure 7
Isoflurane accentuates glutamatergic transmission and plasticity in the hippocampus. (A) Slope of field excitatory postsynaptic potential (fEPSP) recorded in the area CA1 plotted as a function of presynaptic fiber volley (PSFV) amplitude recorded in slices from mice treated with isoflurane (30 min) at 24 hours before (n = 12 slices/8 mice) and in control animals (n = 10 slices/7 mice) (one-way ANOVA: F1,20 = 1.314, p = 0.0479). (B) Paired-pulse facilitation induced by two consecutive stimuli with interpulse interval (IPI) between 10 and 200 msec was not different between the groups (F1,10 = 0.354, p = 0.564). n = 9 slices/8 mice for isoflurane group and n = 10 slices/7 mice for control group. Statistical analysis was done using one-way ANOVA. (C) Long-term potentiation (LTP) induced by high-frequency stimulation (HFS, 100 Hz/1 s) is significantly enhanced in slices from isoflurane treated animals (two-way ANOVA: F1,64 = 7.91, p = 0.000896; n = 8 slices/8 mice for isoflurane group and n = 8 slices/7 mice for control group). Representative fEPSPs taken before and 30 min after the HFS are shown in the insets (control = black, isoflurane = grey).
Figure 8
Figure 8
Isoflurane treatment leads to an increase in the activity of parvalbumin positive interneurons via activation of TrkB. (A) The intensity of FosB staining in parvalbumin positive (PV+) cells, but not somatostatin positive cells (SOM+) or cells not expressing PV or SOM (PV−/SOM−), is significantly increased in the CA1 area of hippocampus of mice treated with isoflurane 24 hours before (p = 0.0474, Student’s t test). (B) Representative figures of the parvalbumin, somatostatin and FosB stainings. (C) Long-term potentiation (LTP) induced by high-frequency stimulation (HFS, 100 Hz) is enhanced in slices from mice treated with isoflurane for 30 min 24 hours before. The difference between the groups disappears in the presence of picrotoxin (PiX). Representative fEPSPs taken 5 min before and 30 min after the HFS are shown in the insets (control = black, isoflurane = dark grey; control/PiX = light gray; isoflurane/PiX = gray). (D) The average frequency of spontaneous IPSCs in CA1 hippocampal neurons recorded at 24 hours after isoflurane anesthesia (30 min) (6 slices/6 animals per group, ANOVA, p < 0.01) and example traces of the recordings. (E) The average frequency of miniature IPSC in CA1 hippocampal neurons (6 slices/6 animals per group, one-way ANOVA) is not affected by isoflurane treatment. (F) Decay time distribution of mIPSC (6 slices per group, Pearson’s χ2 test). (G) The average frequency and example traces of spontaneous IPSC in CA1 hippocampal neurons recorded 24 h after isoflurane anaesthesia in wild-type (WT) and PV-TrkB+/− heterozygous (KO) mice (WT; 6 slices/6 animals for ISO, 5 slices/5 animals for CTRL; KO - PV-TrkB+/−; 7 slices/7 animals for ISO, 5 slices/5 animals for CTRL; ANOVA, p < 0.05). Abbreviations: CTRL, control treatment; ISO, isoflurane treatment. *p < 0.05, **p < 0.01.

References

    1. Kessler RC, et al. The epidemiology of major depressive disorder: results from the National Comorbidity Survey Replication (NCS-R) JAMA J. Am. Med. Assoc. 2003;289:3095–3105. doi: 10.1001/jama.289.23.3095. - DOI - PubMed
    1. Olesen J, et al. The economic cost of brain disorders in Europe. Eur. J. Neurol. Off. J. Eur. Fed. Neurol. Soc. 2012;19:155–162. - PubMed
    1. Fava M. Diagnosis and definition of treatment-resistant depression. Biol. Psychiatry. 2003;53:649–659. doi: 10.1016/S0006-3223(03)00231-2. - DOI - PubMed
    1. Berman RM, et al. Antidepressant effects of ketamine in depressed patients. Biol. Psychiatry. 2000;47:351–354. doi: 10.1016/S0006-3223(99)00230-9. - DOI - PubMed
    1. Duman RS, Aghajanian GK. Synaptic dysfunction in depression: potential therapeutic targets. Science. 2012;338:68–72. doi: 10.1126/science.1222939. - DOI - PMC - PubMed

Publication types

MeSH terms