. 2017 Aug 10;7(1):7800.
doi: 10.1038/s41598-017-08214-4.

Responses of crop yield growth to global temperature and socioeconomic changes

Affiliations

Responses of crop yield growth to global temperature and socioeconomic changes

Toshichika Iizumi et al. Sci Rep. .

Abstract

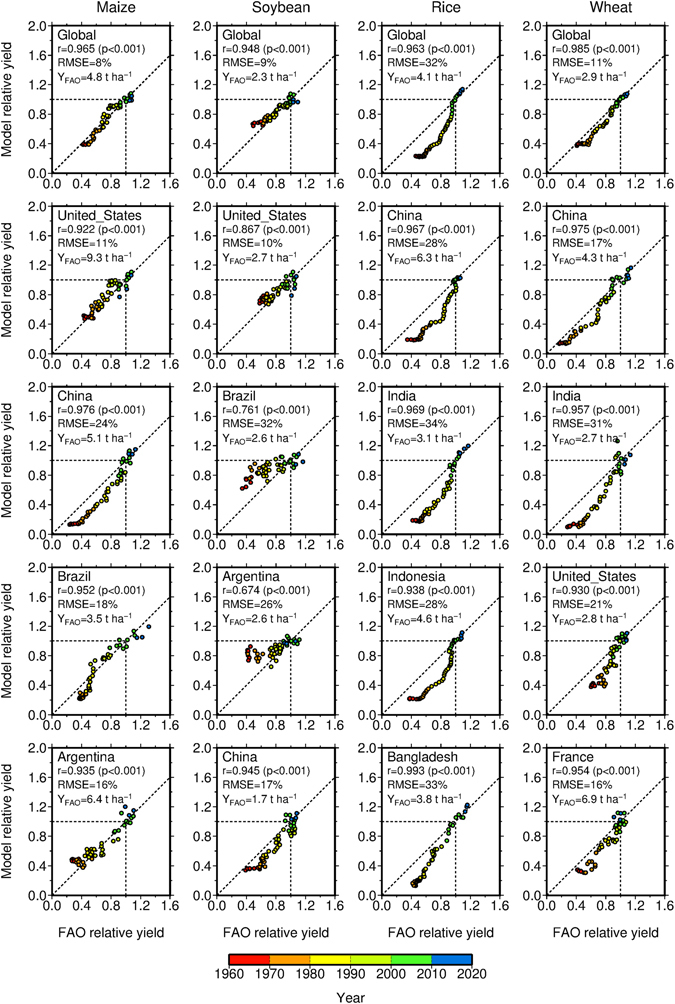
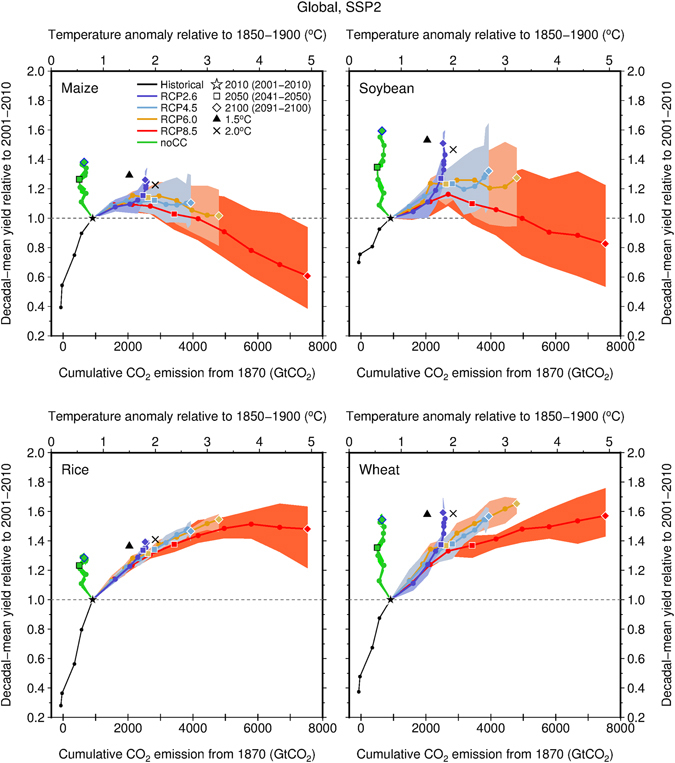
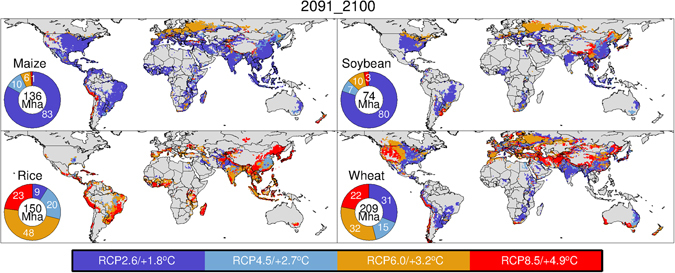
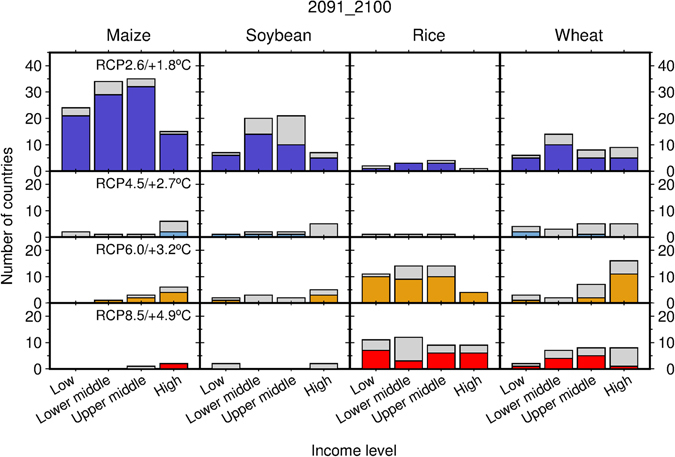
Although biophysical yield responses to local warming have been studied, we know little about how crop yield growth-a function of climate and technology-responds to global temperature and socioeconomic changes. Here, we present the yield growth of major crops under warming conditions from preindustrial levels as simulated by a global gridded crop model. The results revealed that global mean yields of maize and soybean will stagnate with warming even when agronomic adjustments are considered. This trend is consistent across socioeconomic assumptions. Low-income countries located at low latitudes will benefit from intensive mitigation and from associated limited warming trends (1.8 °C), thus preventing maize, soybean and wheat yield stagnation. Rice yields in these countries can improve under more aggressive warming trends. The yield growth of maize and soybean crops in high-income countries located at mid and high latitudes will stagnate, whereas that of rice and wheat will not. Our findings underpin the importance of ambitious climate mitigation targets for sustaining yield growth worldwide.


Conflict of interest statement

The authors declare that they have no competing interests.

Figures

Figure 1
Figure 1
Comparisons of the 2-year running global and country mean yields of four crops for 1961–2012 between the modeled and FAO-reported data. The modeled and reported data were scaled separately to render the mean yield for 2001–2010 equal to one. The correlation (r), p-value (p), root-mean-squared error (RMSE) as a percentage of the mean reported relative yield for 1961–2012, and the mean reported absolute yield for 2001–2010 (YFAO) are also presented. See Post-processing for the crop model output in Supplementary Note for more information.
Figure 2
Figure 2
Responses of crop yield growth to global temperature changes and cumulative CO2 emissions from preindustrial levels under SSP2 (intermediate technological change). Decadal global mean yields of maize, soybean, rice and wheat (y-axis) are expressed as a function of cumulative total global CO2 emissions for 1870 (lower y-axis) or as a function of global decadal mean surface temperature anomalies relative to 1850–1900 (upper y-axis). Solid-colored lines with dots denote the ensemble mean for each RCP calculated from five GCMs. The colored-shaded area denotes the ensemble spread (from minimum to maximum) for each RCP. Data for the assumption of no climate change (noCC, five members) and SSP2 are also presented as a source of reference. Relative yields for a temperature increase of 1.5 °C were linearly interpolated from ensemble mean data derived from the noCC and RCP2.6 cases for 2100, whereas those for a temperature increase of 2 °C were based on the RCP2.6 and RCP4.5 cases for 2100.
Figure 3
Figure 3
The temperature increase and corresponding mitigation level (RCP) at which the anticipated yield growth for 2100 (the average for the period 2091–2100) was found to be the highest for the four RCPs. Any warming above this level leads to yield stagnation. The pie diagrams denote percentages of harvested area under the aforementioned warming levels. All data shown in the pie diagrams are normalized to the global harvested area for 2000. The maps presented here were created from Generic Mapping Tools (GMT) version 4.5.12 (https://www.soest.hawaii.edu/gmt/) using data described in the main text.
Figure 4
Figure 4
The number of countries showing the highest levels of yield growth for 2100 (the average for the period 2091–2100) by level of temperature increase and income level. The RCP corresponding to each level of temperature increase is also presented. Gray bars denote the number of countries producing a crop of interest under the aforementioned combinations of temperature increase and income. Colored bars denote the number of countries for which over 70% of the 15 ensemble members (5 GCMs × 3 SSPs) showed consistent results. The sum of bars over the four panels in a column denotes the number of countries producing a given crop.

References

    1. Ray DK, Ramankutty N, Mueller ND, West PC, Foley JA. Recent patterns of crop yield growth and stagnation. Nat. Commun. 2012;3:1293. doi: 10.1038/ncomms2296. - DOI - PubMed
    1. Ray DK, Mueller ND, West PC, Foley JA. Yield trends are insufficient to double global crop production by 2050. PLoS ONE. 2013;8:e66428. doi: 10.1371/journal.pone.0066428. - DOI - PMC - PubMed
    1. Grassini P, Eskridge KM, Cassman KG. Distinguishing between yield advances and yield plateaus in historical crop production trends. Nat. Commun. 2013;4:2918. doi: 10.1038/ncomms3918. - DOI - PMC - PubMed
    1. Iizumi T, et al. Historical changes in global yields: major cereal and legume crops from 1982 to 2006. Glob. Ecol. Biogeogr. 2014;23:346–357. doi: 10.1111/geb.12120. - DOI
    1. Lobell DB, Gourdji SM. The influence of climate change on global crop productivity. Plant Physiol. 2012;160:1686–1697. doi: 10.1104/pp.112.208298. - DOI - PMC - PubMed

Publication types

LinkOut - more resources