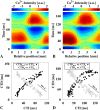
Dynamics of spatiotemporal line defects and chaos control in complex excitable systems
- PMID: 28798384
- PMCID: PMC5552747
- DOI: 10.1038/s41598-017-08011-z
Dynamics of spatiotemporal line defects and chaos control in complex excitable systems
Abstract
Spatiotemporal pattern formation governs dynamics and functions in various biological systems. In the heart, excitable waves can form complex oscillatory and chaotic patterns even at an abnormally higher frequency than normal heart beats, which increase the risk of fatal heart conditions by inhibiting normal blood circulation. Previous studies suggested that line defects (nodal lines) play a critical role in stabilizing those undesirable patterns. However, it remains unknown if the line defects are static or dynamically changing structures in heart tissue. Through in vitro experiments of heart tissue observation, we reveal the spatiotemporal dynamics of line defects in rotating spiral waves. We combined a novel signaling over-sampling technique with a multi-dimensional Fourier analysis, showing that line defects can translate, merge, collapse and form stable singularities with even and odd parity while maintaining a stable oscillation of the spiral wave in the tissue. These findings provide insights into a broad class of complex periodic systems, with particular impact to the control and understanding of heart diseases.
Conflict of interest statement
The authors declare that they have no competing interests.
Figures


Similar articles
-
Period-2 spiral waves supported by nonmonotonic wave dispersion.Phys Rev E Stat Nonlin Soft Matter Phys. 2010 Oct;82(4 Pt 2):046213. doi: 10.1103/PhysRevE.82.046213. Epub 2010 Oct 19. Phys Rev E Stat Nonlin Soft Matter Phys. 2010. PMID: 21230371
-
Termination of spiral wave breakup in a Fitzhugh-Nagumo model via short and long duration stimuli.Chaos. 2002 Sep;12(3):941-951. doi: 10.1063/1.1497836. Chaos. 2002. PMID: 12779618
-
Line-defects-mediated complex-oscillatory spiral waves in a chemical system.Phys Rev E Stat Nonlin Soft Matter Phys. 2006 Jun;73(6 Pt 2):066219. doi: 10.1103/PhysRevE.73.066219. Epub 2006 Jun 23. Phys Rev E Stat Nonlin Soft Matter Phys. 2006. PMID: 16906958
-
Line-defect patterns of unstable spiral waves in cardiac tissue.Phys Rev E Stat Nonlin Soft Matter Phys. 2009 Mar;79(3 Pt 1):030906. doi: 10.1103/PhysRevE.79.030906. Epub 2009 Mar 30. Phys Rev E Stat Nonlin Soft Matter Phys. 2009. PMID: 19391895
-
Suppression of spiral waves and spatiotemporal chaos by generating target waves in excitable media.Phys Rev E Stat Nonlin Soft Matter Phys. 2003 Aug;68(2 Pt 2):026134. doi: 10.1103/PhysRevE.68.026134. Epub 2003 Aug 29. Phys Rev E Stat Nonlin Soft Matter Phys. 2003. PMID: 14525076
Cited by
-
Optical Ultrastructure of Cardiac Tissue Helps to Reproduce Discordant Alternans by In Silico Data Assimilation.Conf Eur Study Group Cardiovasc Oscil. 2022 Oct;2022:10.1109/esgco55423.2022.9931369. doi: 10.1109/esgco55423.2022.9931369. Epub 2022 Nov 7. Conf Eur Study Group Cardiovasc Oscil. 2022. PMID: 40070815 Free PMC article.
-
Thermal effects on cardiac alternans onset and development: A spatiotemporal correlation analysis.Phys Rev E. 2021 Apr;103(4):L040201. doi: 10.1103/PhysRevE.103.L040201. Phys Rev E. 2021. PMID: 34005953 Free PMC article.
-
Spatial distribution of heterogeneity as a modulator of collective dynamics in pancreatic beta-cell networks and beyond.Front Netw Physiol. 2023 Mar 24;3:1170930. doi: 10.3389/fnetp.2023.1170930. Front Netw Physiol. 2023. PMID: 36987428 Free PMC article.
-
A cross species thermoelectric and spatiotemporal analysis of alternans in live explanted hearts using dual voltage-calcium fluorescence optical mapping.Physiol Meas. 2024 Jun 4;45(6):10.1088/1361-6579/ad4e8f. doi: 10.1088/1361-6579/ad4e8f. Physiol Meas. 2024. PMID: 38772394 Free PMC article.
-
Native mechano-regulative matrix properties stabilize alternans dynamics and reduce spiral wave stabilization in cardiac tissue.Front Netw Physiol. 2024 Sep 24;4:1443156. doi: 10.3389/fnetp.2024.1443156. eCollection 2024. Front Netw Physiol. 2024. PMID: 39381499 Free PMC article.
References
-
- Winfree, A. The geometry of biological time, vol. 8 (Springer, 1980).
Publication types
LinkOut - more resources
Full Text Sources
Other Literature Sources
Molecular Biology Databases

