. 2017 Aug 10;7(1):7856.
doi: 10.1038/s41598-017-08170-z.

Centennial-scale reductions in nitrogen availability in temperate forests of the United States

Affiliations

Centennial-scale reductions in nitrogen availability in temperate forests of the United States

K K McLauchlan et al. Sci Rep. .

Abstract

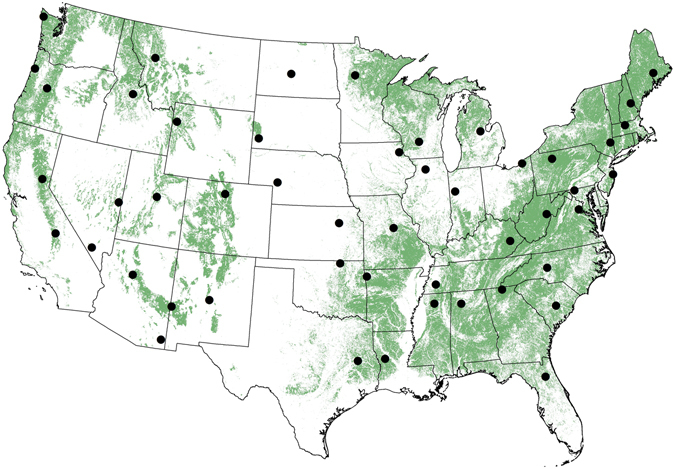
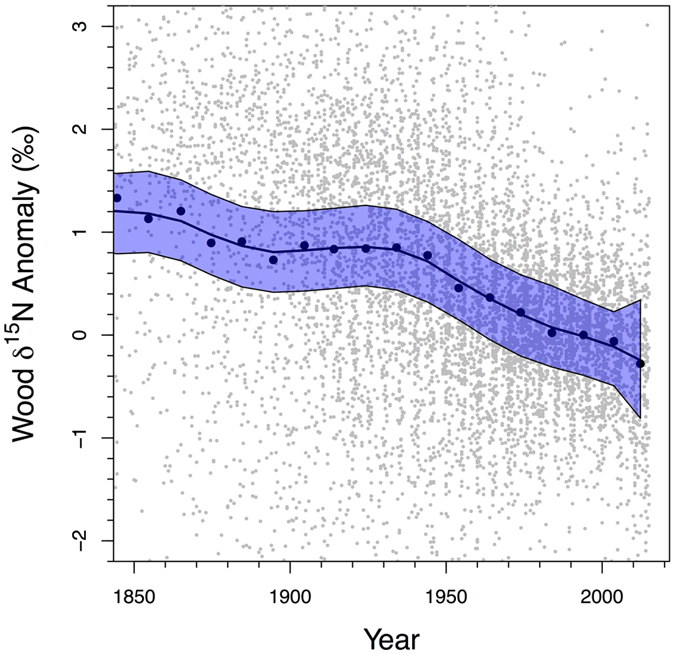
Forests cover 30% of the terrestrial Earth surface and are a major component of the global carbon (C) cycle. Humans have doubled the amount of global reactive nitrogen (N), increasing deposition of N onto forests worldwide. However, other global changes-especially climate change and elevated atmospheric carbon dioxide concentrations-are increasing demand for N, the element limiting primary productivity in temperate forests, which could be reducing N availability. To determine the long-term, integrated effects of global changes on forest N cycling, we measured stable N isotopes in wood, a proxy for N supply relative to demand, on large spatial and temporal scales across the continental U.S.A. Here, we show that forest N availability has generally declined across much of the U.S. since at least 1850 C.E. with cool, wet forests demonstrating the greatest declines. Across sites, recent trajectories of N availability were independent of recent atmospheric N deposition rates, implying a minor role for modern N deposition on the trajectory of N status of North American forests. Our results demonstrate that current trends of global changes are likely to be consistent with forest oligotrophication into the foreseeable future, further constraining forest C fixation and potentially storage.


Conflict of interest statement

The authors declare that they have no competing interests.

Figures

Figure 1
Figure 1
Locations of 49 sites sampled for wood δ15N in the continental U.S.A. Woody cover (green) is from the Commission for Environmental Cooperation. Full site information is available in Supplementary Table 1. Map was generated in ArcGIS 10.1 (https://www.arcgis.com/features/index.html).
Figure 2
Figure 2
Changes in wood δ15N values since 1850 C.E. The change in wood δ15N anomaly averaged at the decadal scale. All wood δ15N data for each tree core was arithmetically adjusted to have a mean wood δ15N of 0‰ from 1970–2015 and then wood δ15N anomalies were averaged for each decade (black symbols). Gray symbols represent unsummarized individual adjusted wood δ15N values (N = 8934). Thin black lines and blue area represent 95% confidence interval for the loess-smoothed curve of wood δ15N values.
Figure 3
Figure 3
The effect of three site-specific variables on trajectories of wood δ15N since 1970 C.E. (a) log of mean annual precipitation (estimate −0.069 ± 0.018, P < 0.001) (b) mean annual temperature (estimate 0.0028 ± 0.0008, P < 0.001) (c) atmospheric N deposition (estimate −0.0014 ± 0.0009, P = 0.12). (d) map of modeled wood δ15N trajectories since 1970 C.E. using these regression relationships for forested areas in the U.S. Units are ‰ y−1. Data source for forested area: Commission for Environmental Cooperation. For panel d, the projection of δ15N trends was generated by using free software R (R Core Team (2013). R: A language and environment for statistical computing. R Foundation for Statistical Computing, Vienna, Austria. URL: https://www.R-project.org/) and the map was generated in ArcGIS 10.1.

References

    1. Niu SL, et al. Global patterns and substrate-based mechanisms of the terrestrial nitrogen cycle. Ecol Lett. 2016;19:697–709. doi: 10.1111/ele.12591. - DOI - PubMed
    1. Compton JE, et al. Ecosystem services altered by human changes in the nitrogen cycle: a new perspective for US decision making. Ecol Lett. 2011;14:804–815. doi: 10.1111/j.1461-0248.2011.01631.x. - DOI - PubMed
    1. Steffen W, et al. Sustainability. Planetary boundaries: guiding human development on a changing planet. Science. 2015;347:1259855. doi: 10.1126/science.1259855. - DOI - PubMed
    1. Rockström J, et al. A safe operating space for humanity. Nature. 2009;461:472–475. doi: 10.1038/461472a. - DOI - PubMed
    1. Reich PB, Hobbie SE. Decade-long soil nitrogen constraint on the CO2 fertilization of plant biomass. Nature Climate Change. 2013;3:278–282. doi: 10.1038/nclimate1694. - DOI

Publication types

LinkOut - more resources