. 2017 Aug 24;9(33):12096-12109.
doi: 10.1039/c7nr02558k.

Viral nanoparticles decorated with novel EGFL7 ligands enable intravital imaging of tumor neovasculature

Affiliations

Viral nanoparticles decorated with novel EGFL7 ligands enable intravital imaging of tumor neovasculature

Choi-Fong Cho et al. Nanoscale. .

Abstract

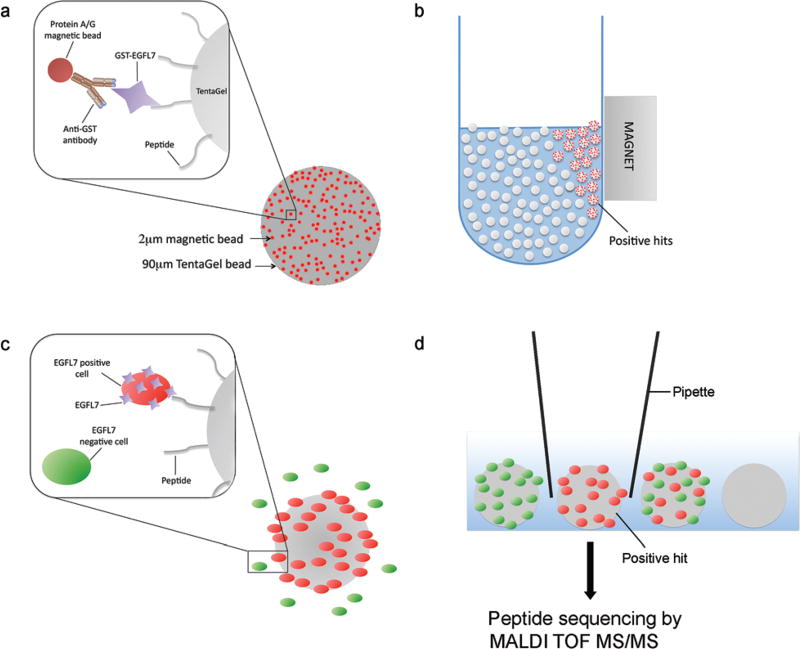
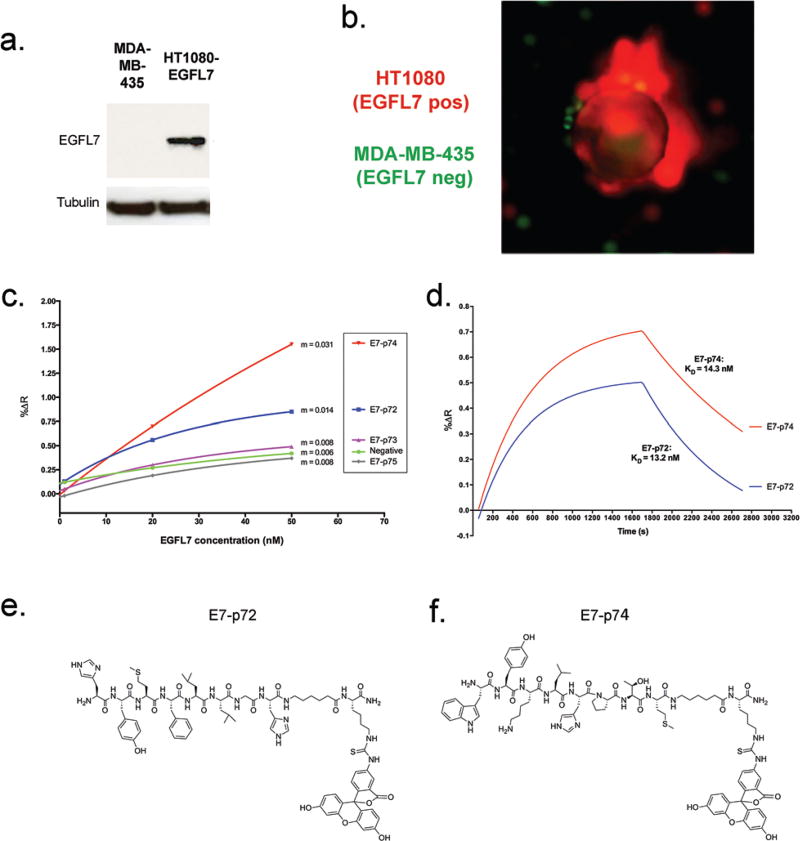
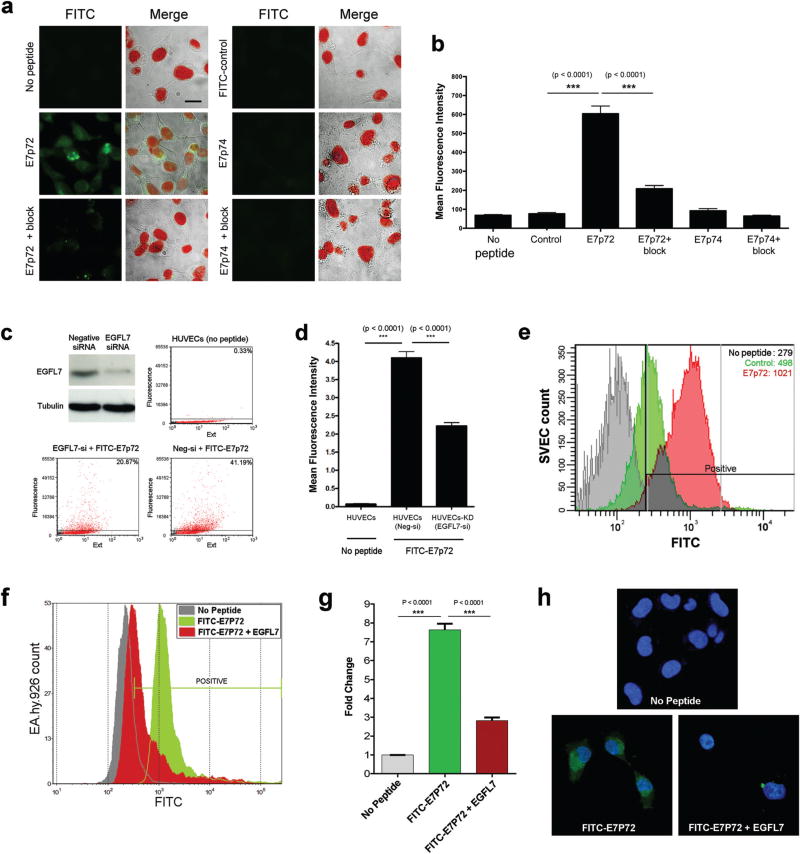
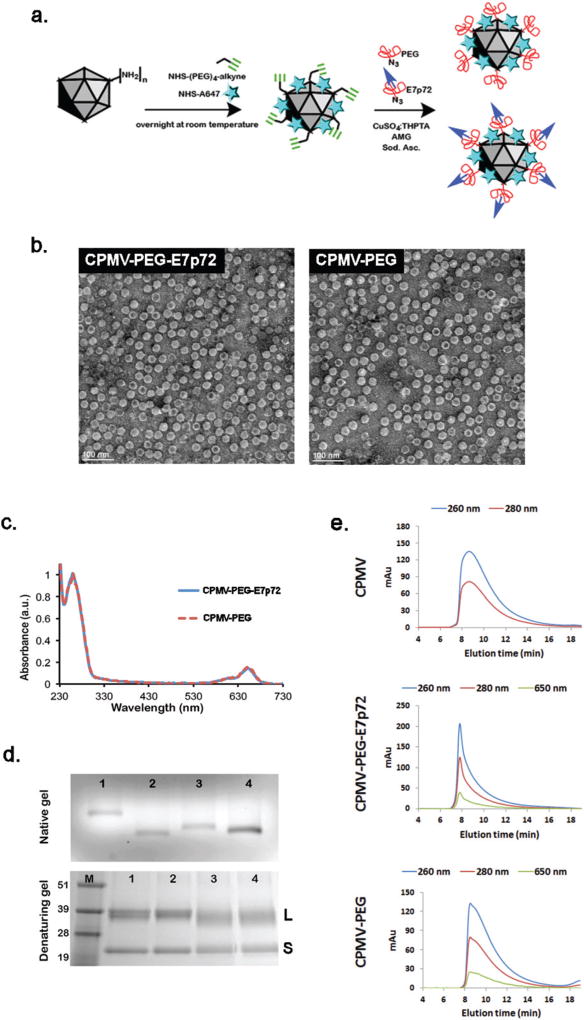
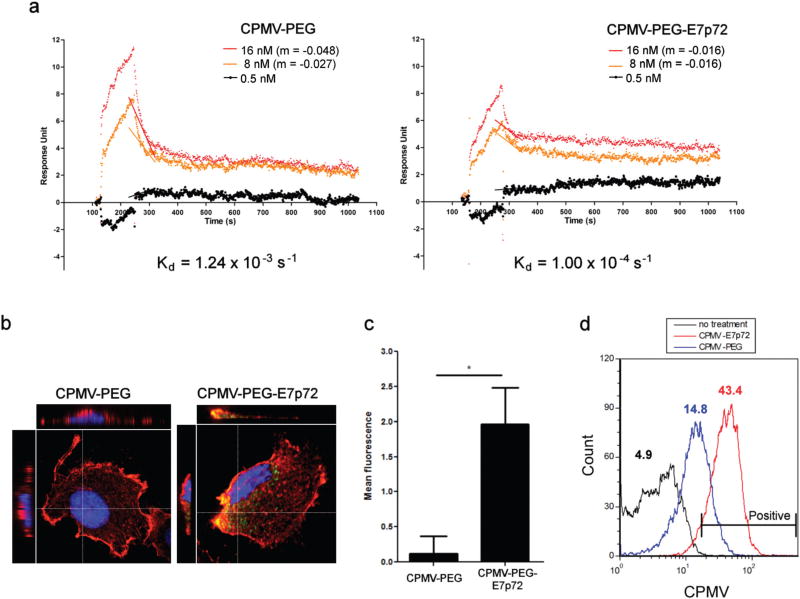
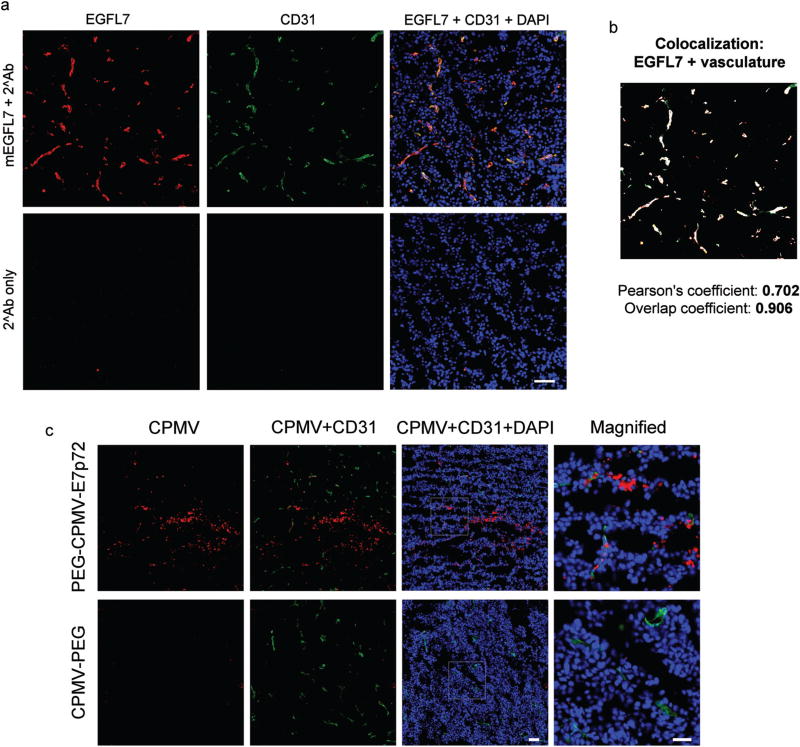
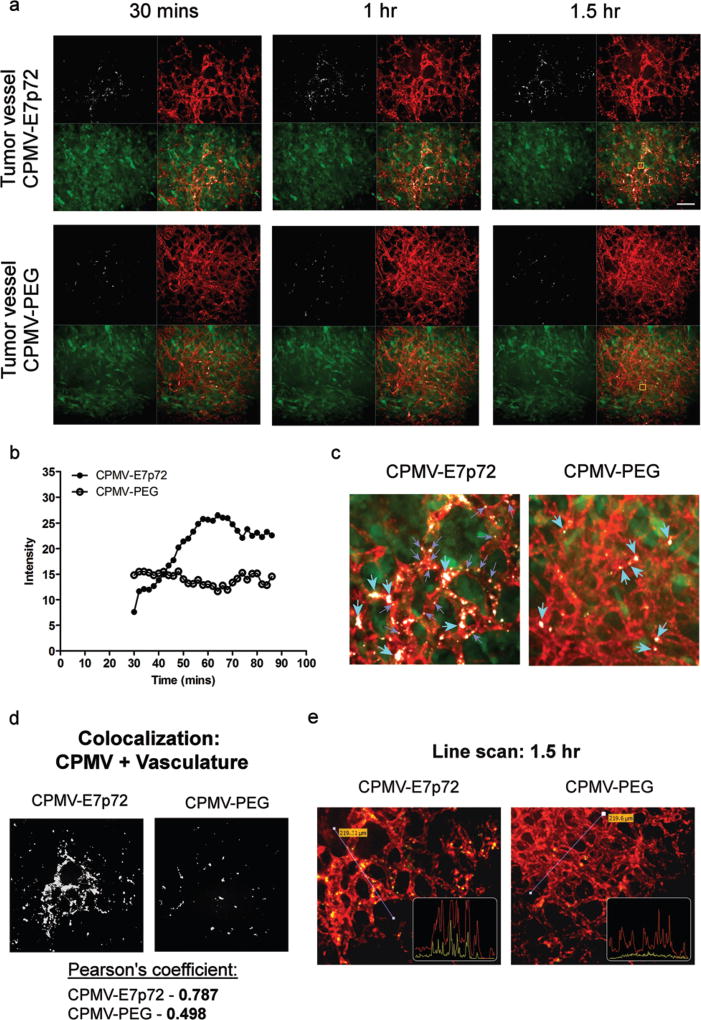
Angiogenesis is a dynamic process fundamental to the development of solid tumors. Epidermal growth factor-like domain 7 (EGFL7) is a protein whose expression is restricted to endothelial cells undergoing active remodeling that has emerged as a key mediator of this process. EGFL7 expression is associated with poor outcome in several cancers, making it a promising target for imaging or therapeutic strategies. Here, EGFL7 is explored as a molecular target for active neovascularization. Using a combinatorial peptide screening approach, we describe the discovery and characterization of a novel high affinity EGFL7-binding peptide, E7p72, that specifically targets human endothelial cells. Viral nanoparticles decorated with E7p72 peptides specifically target tumor-associated neovasculature with high specificity as assessed by intravital imaging. This work highlights the value of EGFL7 as a target for angiogenic vessels and opens the door for novel targeted therapeutic approaches.


Conflict of interest statement

Conflicts of interest

There are no conflicts of interest to declare.

Figures

Fig. 1
Fig. 1
Two-stage strategy for screening an OBOC peptide library against recombinant EGFL7 protein. (a) Schematic representation of the ‘beads on a bead’ approach to screen for EGFL7-binding peptides. Purified recombinant GST-EGFL7 protein was bound onto protein A/G-coated magnetic beads via an anti-GST antibody, and mixed with a library of Tentagel beads displaying random 8-amino acid peptides. (b) Tentagel beads displaying high affinity peptides that strongly retained magnetic beads were isolated using a magnet. (c) Schematic representation of a secondary cell-based screen using EGFL7-overexpressing cells and EGFL7-negative cells. (d) Beads with high affinity peptide for EGFL7 expressed on the cellular surface were coated with tdTomato cells (but not GFP cells). These beads were selected and isolated under a microscope using a micropipette, and peptides were sequenced on-bead using MALDI TOF MS/MS.
Fig. 2
Fig. 2
Identification of novel EGFL7 ligands. (a) A secondary cell-based screening approach to identify peptides with high affinity for EGFL7 displayed on the cell surface. Western blot analysis using a polyclonal anti-EGFL7 antibody shows negligible EGFL7 in MDA435-GFP cells and high EGFL7 expression in HT1080-tdT cells overexpressing EGFL7. (b) Fluorescence image of an example hit bead that strongly associated with HT1080-tdT cells that overexpress EGFL7 (red), but have very little interaction with MDA435-GFP cells (green) that do not express EGFL7. (c) Association curves were produced by exposing peptides immobilized onto the SPR chip with a continuous flow of increasing EGFL7 concentrations (1 nM, 20 nM, and 50 nM). At t = 600 s (10 min), the percent change in reflectivity (%ΔR) due to EGFL7 binding was plotted against EGFL7 concentration (nM), and the slope (m) of each line was obtained. (d) Association and dissociation curves were generated based on the interaction of E7p72 and E7p74 with purified EGFL7 (15.6 nM) using the SPRimager II. Association curves were obtained by exposing peptides immobilized onto the SPR chip with a continuous flow of EGFL7. At t = 1700 s, the dissociation curves were generated when the flow of EGFL7 was replaced with binding buffer. Fitted curves and KD values were generated using the ‘association-then-dissociation’ equation in GraphPad Prism. (e) Chemical structure of fluorescein-labeled E7p72 (top) and (f) E7p74 (bottom).
Fig. 3
Fig. 3
E7p72 targets endothelial cells in an EGFL7-dependent manner. (a) Fluorescence images showing the uptake of FITC-conjugated E7-p72, E7-p74 and a control peptide (final concentration = 3.3 microM) by HT1080 cells. Left panels: FITC signal from peptide uptake (green). Right panels: Merged images of brightfield image, nuclei staining (red) and FITC-conjugated peptide (green). A blocking study was conducted by adding 100× molar excess of non-labeled peptides. Scale bar, 10 microns. (b) Bar graph showing the mean fluorescence intensity of cells from each group. The perimeter of each cell was selected, and the mean FITC intensity within each selected region was measured using Volocity software. The uptake of FITC-E7p72, but not FITC-E7p74 was significantly higher than that of control peptide (n = 30, p < 0.001). FITC-E7p72 binding was significantly reduced in the presence of 100× excess unlabeled E7p72 peptide (n = 30, p < 0.001). (c) Western blot analysis showing EGFL7 expression and EGFL7 knockdown (by siRNA) in HUVECs using the EGFL7 polyclonal antibody (top left). Dot plots show the uptake of FITC-E7p72 by HUVECs or HUVECs-KD (EGFL7 knockdown). Flow cytometry analysis was performed using the COPAS flow cytometer (Union Biometrica) and the plots were generated using FCS express (version 3). (d) Bar graph showing the uptake of FITC-E7p72 by HUVECs or HUVECs-KD. All statistics were performed using a one-way ANOVA and Tukey post hoc test. (e) Histogram showing the uptake of FITC-conjugated E7p72 (red) or control peptide (green) (final concentration = 3.3 mM) by mouse endothelial cells (SVEC). The mean fluorescence intensity of each group is indicated in the plot. (f) Histogram showing the uptake of FITC-conjugated E7p72 by human endothelial cells (EA.hy926) in the presence or absence of EGFL7 (final concentration = 3.3 mM) using the Fortessa X-20 flow cytometer. (g) Bar graph showing a 64.5% decrease in the uptake of FITC-E7p72 in the presence of EGFL7 by EA.hy926 cells. All statistics were performed using a one-way ANOVA and Tukey post hoc test. (h) Confocal images showing uptake of FITC-E7p72 (green) by EA.hy926 cells were captured at 63× magnification. FITC-E7p72 (in green) and Hoechst 33342 stained nuclei staining (in blue) are shown here. Scale bar, 20 microns.
Fig. 4
Fig. 4
Synthesis and characterization of viral nanoparticles targeting EGFL7. (a) Schematic showing the two-step synthesis protocol employed for the modification of CPMV particles: (1) A647 and alkyne handles are introduced; (2) CuAAC chemistry is used to conjugate the PEG-E7p72 peptide or PEG molecules. (b) Transmission electron microscope images of CPMV-PEG-E7p72 or CPMV-PEG nanoparticle. Scale bar, 100 nm. (c) UV/visible spectra of CPMV-PEG-E7p72 confirming conjugation of ~25 NIR dyes per CPMV formulation. (d) Native (top panel) and denaturing (bottom panel) gel electrophoresis. The native gel was stained with ethidium bromide and imaged under UV light, while the denaturing gel was stained with Coomassie dye and imaged under white light. 1 = CPMV, 2 = CPMV-647-alkyne intermediate, 3 = CPMV-PEG-E7p72, 4 = CPMV-PEG. M corresponds to the molecular weight marker (molecular weights are indicated in kDa). (e) Size exclusion chromatography (SEC) of CPMV, CPMV-PEG and CPMV-PEG-E7p72 (1 mg mL−1; flow rate 0.5 mL min−1) using a Superose6 column on the ÄKTA Explorer chromatography system.
Fig. 5
Fig. 5
CPMV-PEG-E7p72 nanoparticles target human endothelial cells. (a) SPR curves generated from the interaction and dissociation of CPMV-PEG-E7p72 or CPMV-PEG nanoparticle (at concentrations 16 nM, 8 nM and 0.5 nM) with immobilized EGFL7 using the Biacore 3000. Association curves were obtained by exposing EGFL7 immobilized on the SPR chip with CPMV-PEG-E7p72 or CPMV-PEG (control) nanoparticle. At t = 280 s, the dissociation curves were generated when the injection of nanoparticles was substituted with binding buffer. CPMV-PEG-E7p72 nanoparticle displayed a much lower dissociation rate compared to CPMV-PEG. The slopes (m) depicting the dissociation rates of the two highest concentrations are indicated in this plot. (b) (Left) Confocal images (using the 20× objective) showing the uptake of CPMV-PEG-E7p72 nanoparticle (white arrow), but not control CPMV-PEG nanoparticle by human endothelial cells. AF 647 signal from CPMV (green), plasma membrane labeled with wheat germ agglutinin (WGA) (red), and nuclei staining (blue). Scale bar, 10 microns. (Right) Bar graph showing the mean fluorescence intensity of cells from each group. Quantification of peptide uptake was performed by obtaining the mean AF 647 signal intensity within each cell using Volocity software, v 6.1. The uptake of CPMV-PEG-E7p72, was significantly higher than that of control CPMV-PEG (n = 20, p < 0.05). All statistics were performed using a one-way ANOVA and Tukey post hoc test. (c) Z-Stack confocal microscopy images (using the 60× objective) of cells from (b) showing the internalization of CPMV-PEG-E7p72 nanoparticles. (d) Histogram indicating the uptake of CPMV-PEG-E7p72 and CPMV-PEG (control) by EA.hy926 endothelial cells. Flow cytometry was conducted using the BD FACSCalibur flow cytometer and data was analyzed using the FCS Express software. The mean fluorescence intensity of each group is indicated in the plot (n = 10 000).
Fig. 6
Fig. 6
CPMV-PEG-E7p72 nanoparticle binds HT1080 tumor and neovasculature ex vivo. (a) Fluorescence images of HT1080 tumor tissues sections showing the expression of EGFL7 in tumor neovasculature. Immunofluorescence staining was performed to detect mouse EGFL7 (red), CD31 vascular marker (green), and nuclei (blue). Scale bar, 50 microns. (b) Composite image showing areas of mEGFL7 and CD31 localization (white). This image was generated using ImageJ (Colocalization Finder plugin). (c) Fluorescence images showing that CPMV-PEG-E7p72, but not CPMV-PEG nanoparticles bind to the tumor-associated neovasculature as well as HT1080 tumor tissues ex vivo. CPMV (red), CD31 (green), and nuclei (blue). Scale bar, 50 microns. Right panel shows high magnification of inset. Scale bar, 25 microns.
Fig. 7
Fig. 7
CPMV-PEG-E7p72 nanoparticles bind tumor neovasculature in vivo. (a) Real-time live intravital imaging of tumor neovasculature and normal blood vessels using confocal microscopy. CPMV-PEG-E7p72, but not CPMV-PEG control nanoparticle, accumulated in tumor endothelium (small green arrows) over 1.5 hours. Blood vessels were labeled with lectin rhodamine. CPMV (white), endothelium (red), and HT1080 tumor (green). Scale bar, 30 microns. (b) Quantification of the CPMV accumulation in tumor blood vessel (region of quantification is indicated by yellow box in (a)). (c) Magnified image from inset in (a) showing internalization CPMV-PEG-E7p72 in vesicles of tumor endothelium (small purple arrows). Macrophages that have taken up both nanoparticles were seen in circulation (large turquoise arrows). (d) Image showing areas of CPMV and lectin colocalization (white). This image was generated using ImageJ (Colocalization Finder plugin). Pearson’s coefficient demonstrating the colocalization of CPMV and lectin were obtained from Volocity software. (e) Line profile through the tumor endothelium shows accumulation of CPMV-PEG-E7p72, but not CPMV-PEG nanoparticle (yellow line) in the blood vessels (red line) 1.5 hours after injection.

References

    1. Fox SB, Harris AL. Invest. New Drugs. 1997;15:15–28. - PubMed
    1. Chinot OL, Wick W, Mason W, Henriksson R, Saran F, Nishikawa R, Carpentier AF, Hoang-Xuan K, Kavan P, Cernea D, Brandes AA, Hilton M, Abrey L, Cloughesy T. N. Engl. J. Med. 2014;370:709–722. - PubMed
    1. Gilbert MR, Dignam JJ, Armstrong TS, Wefel JS, Blumenthal DT, Vogelbaum MA, Colman H, Chakravarti A, Pugh S, Won M, Jeraj R, Brown PD, Jaeckle KA, Schiff D, Stieber VW, Brachman DG, Werner-Wasik M, Tremont-Lukats IW, Sulman EP, Aldape KD, Curran WJ, Jr, Mehta MP. N. Engl. J. Med. 2014;370:699–708. - PMC - PubMed
    1. Ray-Coquard IL, Domont J, Tresch-Bruneel E, Bompas E, Cassier PA, Mir O, Piperno-Neumann S, Italiano A, Chevreau C, Cupissol D, Bertucci F, Bay JO, Collard O, Saada-Bouzid E, Isambert N, Delcambre C, Clisant S, Le Cesne A, Blay JY, Penel N. J. Clin. Oncol. 2015;33:2797–2802. - PubMed
    1. Pinter M, Ulbrich G, Sieghart W, Kölblinger C, Reiberger T, Li S, Ferlitsch A, Müller C, Lammer J, Peck-Radosavljevic M. Radiology. 2015;277:903–912. - PubMed

LinkOut - more resources