

B cell phenotypes in patients with rheumatoid arthritis relapsing after rituximab: expression of B cell-activating factor-binding receptors on B cell subsets
- PMID: 28800164
- PMCID: PMC5680059
- DOI: 10.1111/cei.13024
B cell phenotypes in patients with rheumatoid arthritis relapsing after rituximab: expression of B cell-activating factor-binding receptors on B cell subsets
Abstract
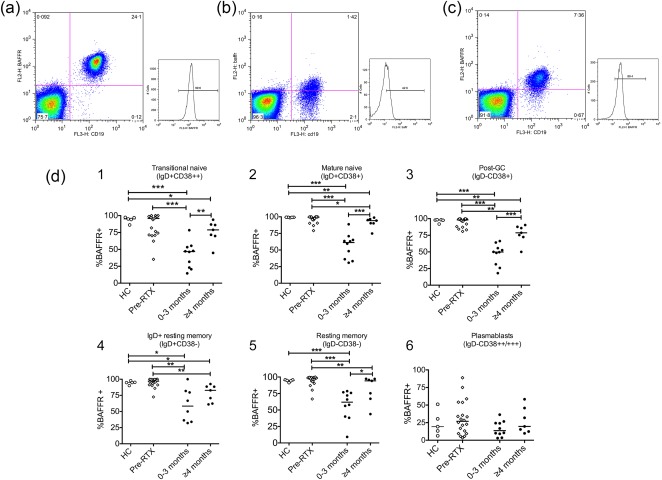
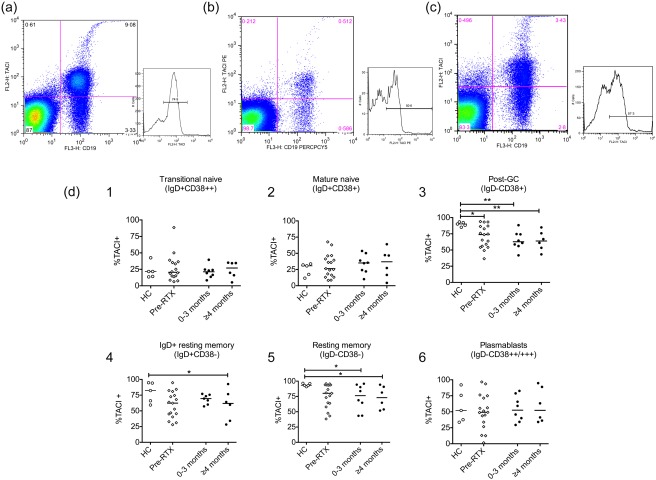
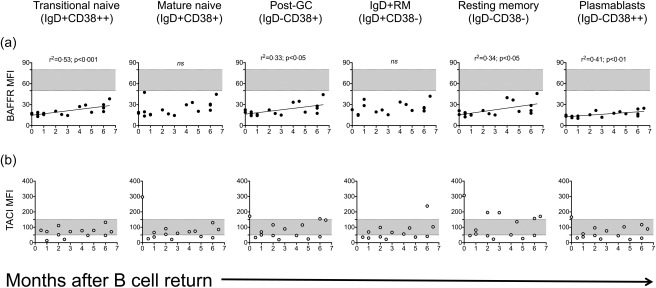
Serum levels of B cell-activating factor (BAFF) rise following rituximab (RTX) therapy in patients with rheumatoid arthritis (RA). Initiation of naive B cell return to the periphery and autoreactive B cell expansion leading to relapse after RTX may therefore be linked to interactions between BAFF and BAFF-binding receptors (BBR). Relationships between serum BAFF and BBR expression [(BAFFR, calcium signal modulating cyclophilic ligand interactor (TACI) and B cell maturation antigen (BCMA)] were determined on B cell subsets, defined using immunoglobulin (Ig)D/CD38. Twenty pre-RTX and 18 RA patients relapsing after B cell depletion were included. Results were analysed with respect to timing of relapse up to 7 months after peripheral B cell return (≥ 5 B cells/μl) and to serum BAFF levels. After B cell return, B cell populations from relapsing patients had significantly lower BAFFR+ expression compared to HC and pre-RTX patients. The percentage of BAFFR+ B cells increased with time after B cell return and was correlated inversely with serum BAFF levels. BAFFR expression remained reduced. The percentage of TACI+ memory B cells were lower in RA patients after RTX compared with healthy controls (HC). BCMA expression (% and expression) did not differ between patients and HC. Relapse following B cell return appeared largely independent of the percentage of BAFFR+ or percentage of BCMA+ B cells or serum BAFF levels. The lower percentage of TACI+ memory B cells may reduce inhibitory signalling for B cell differentiation. In patients relapsing at longer periods after B cell return, recovery of the B cell pool was more complete, suggesting that selection or expansion of autoreactive B cells may be needed to precipitate relapse.
Keywords: B lymphocytes; rheumatoid arthritis; rituximab.
© 2017 British Society for Immunology.
Figures


Similar articles
-
The effect of B-cell depletion therapy on serological evidence of B-cell and plasmablast activation in patients with rheumatoid arthritis over multiple cycles of rituximab treatment.J Autoimmun. 2014 May;50:67-76. doi: 10.1016/j.jaut.2013.12.002. Epub 2013 Dec 22. J Autoimmun. 2014. PMID: 24365380
-
B cell activating factor (BAFF) and BAFF receptors: fakes and facts.Clin Exp Immunol. 2017 Dec;190(3):291-292. doi: 10.1111/cei.13039. Epub 2017 Sep 28. Clin Exp Immunol. 2017. PMID: 28834574 Free PMC article. Review.
-
Association of BAFF, APRIL serum levels, BAFF-R, TACI and BCMA expression on peripheral B-cell subsets with clinical manifestations in systemic lupus erythematosus.Lupus. 2016 May;25(6):582-92. doi: 10.1177/0961203315608254. Epub 2015 Sep 29. Lupus. 2016. PMID: 26424128
-
Effect of rituximab on B cell phenotype and serum B cell-activating factor levels in patients with thrombotic thrombocytopenic purpura.Clin Exp Immunol. 2015 Mar;179(3):414-25. doi: 10.1111/cei.12472. Clin Exp Immunol. 2015. PMID: 25339550 Free PMC article.
-
BAFF receptor and TACI in B-1b cell maintenance and antibacterial responses.Ann N Y Acad Sci. 2015 Dec;1362:57-67. doi: 10.1111/nyas.12772. Epub 2015 May 11. Ann N Y Acad Sci. 2015. PMID: 25962322 Review.
Cited by
-
Reemergence of pathogenic, autoantibody-producing B cell clones in myasthenia gravis following B cell depletion therapy.Acta Neuropathol Commun. 2022 Oct 28;10(1):154. doi: 10.1186/s40478-022-01454-0. Acta Neuropathol Commun. 2022. PMID: 36307868 Free PMC article.
-
Hypogammaglobulinemia, late-onset neutropenia, and infections following rituximab.Ann Allergy Asthma Immunol. 2023 Jun;130(6):699-712. doi: 10.1016/j.anai.2023.01.018. Epub 2023 Jan 24. Ann Allergy Asthma Immunol. 2023. PMID: 36706910 Free PMC article. Review.
-
Single-cell repertoire tracing identifies rituximab-resistant B cells during myasthenia gravis relapses.JCI Insight. 2020 Jul 23;5(14):e136471. doi: 10.1172/jci.insight.136471. JCI Insight. 2020. PMID: 32573488 Free PMC article.
-
Target modulation and pharmacokinetics/pharmacodynamics translation of the BTK inhibitor poseltinib for model-informed phase II dose selection.Sci Rep. 2021 Sep 21;11(1):18671. doi: 10.1038/s41598-021-98255-7. Sci Rep. 2021. PMID: 34548595 Free PMC article.
-
Expression quantitative trait loci analysis in rheumatoid arthritis identifies tissue specific variants associated with severity and outcome.Ann Rheum Dis. 2024 Feb 15;83(3):288-299. doi: 10.1136/ard-2023-224540. Ann Rheum Dis. 2024. PMID: 37979960 Free PMC article.
References
-
- Darce JR, Arendt BK, Wu X, Jelinek DF. Regulated expression of BAFF‐binding receptors during human B cell differentiation. J Immunol 2007; 179:7276–86. - PubMed
-
- Rodig SJ, Shahsafaei A, Li B, Mackay CR, Dorfman DM. BAFF‐R, the major B cell‐activating factor receptor, is expressed on most mature B cells and B‐cell lymphoproliferative disorders. Hum Pathol 2005; 36:1113–9. - PubMed
-
- Darce JR, Arendt BK, Chang SK, Jelinek DF. Divergent effects of BAFF on human memory B cell differentiation into Ig‐secreting cells. J Immunol 2007; 178:5612–22. - PubMed
Publication types
MeSH terms
Substances
LinkOut - more resources
Full Text Sources
Other Literature Sources
Medical
Research Materials
