

Analytical Strategy to Prioritize Alzheimer's Disease Candidate Genes in Gene Regulatory Networks Using Public Expression Data
- PMID: 28800327
- PMCID: PMC5611835
- DOI: 10.3233/JAD-170011
Analytical Strategy to Prioritize Alzheimer's Disease Candidate Genes in Gene Regulatory Networks Using Public Expression Data
Abstract
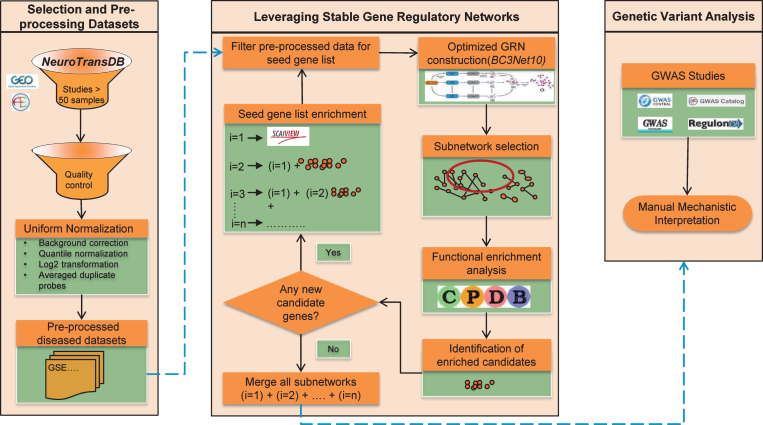
Alzheimer's disease (AD) progressively destroys cognitive abilities in the aging population with tremendous effects on memory. Despite recent progress in understanding the underlying mechanisms, high drug attrition rates have put a question mark behind our knowledge about its etiology. Re-evaluation of past studies could help us to elucidate molecular-level details of this disease. Several methods to infer such networks exist, but most of them do not elaborate on context specificity and completeness of the generated networks, missing out on lesser-known candidates. In this study, we present a novel strategy that corroborates common mechanistic patterns across large scale AD gene expression studies and further prioritizes potential biomarker candidates. To infer gene regulatory networks (GRNs), we applied an optimized version of the BC3Net algorithm, named BC3Net10, capable of deriving robust and coherent patterns. In principle, this approach initially leverages the power of literature knowledge to extract AD specific genes for generating viable networks. Our findings suggest that AD GRNs show significant enrichment for key signaling mechanisms involved in neurotransmission. Among the prioritized genes, well-known AD genes were prominent in synaptic transmission, implicated in cognitive deficits. Moreover, less intensive studied AD candidates (STX2, HLA-F, HLA-C, RAB11FIP4, ARAP3, AP2A2, ATP2B4, ITPR2, and ATP2A3) are also involved in neurotransmission, providing new insights into the underlying mechanism. To our knowledge, this is the first study to generate knowledge-instructed GRNs that demonstrates an effective way of combining literature-based knowledge and data-driven analysis to identify lesser known candidates embedded in stable and robust functional patterns across disparate datasets.
Keywords: Alzheimer’s disease; gene regulatory networks; microarray analysis; synaptic transmission.
Figures
Similar articles
-
Exploring matrix factorization techniques for significant genes identification of Alzheimer's disease microarray gene expression data.BMC Bioinformatics. 2011;12 Suppl 5(Suppl 5):S7. doi: 10.1186/1471-2105-12-S5-S7. Epub 2011 Jul 27. BMC Bioinformatics. 2011. PMID: 21989140 Free PMC article.
-
Computational studies on Alzheimer's disease associated pathways and regulatory patterns using microarray gene expression and network data: revealed association with aging and other diseases.J Theor Biol. 2013 Oct 7;334:109-21. doi: 10.1016/j.jtbi.2013.06.013. Epub 2013 Jun 26. J Theor Biol. 2013. PMID: 23811083
-
A regulatory role for the insulin- and BDNF-linked RORA in the hippocampus: implications for Alzheimer's disease.J Alzheimers Dis. 2015;44(3):827-38. doi: 10.3233/JAD-141731. J Alzheimers Dis. 2015. PMID: 25362032
-
Establishing genomic/transcriptomic links between Alzheimer's disease and type 2 diabetes mellitus by meta-analysis approach.CNS Neurol Disord Drug Targets. 2014 Apr;13(3):501-16. doi: 10.2174/18715273113126660154. CNS Neurol Disord Drug Targets. 2014. PMID: 24059308 Review.
-
Harnessing the power of gene microarrays for the study of brain aging and Alzheimer's disease: statistical reliability and functional correlation.Ageing Res Rev. 2005 Nov;4(4):481-512. doi: 10.1016/j.arr.2005.06.006. Epub 2005 Oct 27. Ageing Res Rev. 2005. PMID: 16257272 Review.
Cited by
-
coMethDMR: accurate identification of co-methylated and differentially methylated regions in epigenome-wide association studies with continuous phenotypes.Nucleic Acids Res. 2019 Sep 26;47(17):e98. doi: 10.1093/nar/gkz590. Nucleic Acids Res. 2019. PMID: 31291459 Free PMC article.
-
A Systematic Bioinformatics Workflow With Meta-Analytics Identified Potential Pathogenic Factors of Alzheimer's Disease.Front Neurosci. 2020 Mar 13;14:209. doi: 10.3389/fnins.2020.00209. eCollection 2020. Front Neurosci. 2020. PMID: 32231518 Free PMC article.
-
Gene Regulatory Networks in Peripheral Mononuclear Cells Reveals Critical Regulatory Modules and Regulators of Multiple Sclerosis.Sci Rep. 2019 Sep 4;9(1):12732. doi: 10.1038/s41598-019-49124-x. Sci Rep. 2019. PMID: 31484947 Free PMC article.
-
DeepGAMI: deep biologically guided auxiliary learning for multimodal integration and imputation to improve genotype-phenotype prediction.Genome Med. 2023 Oct 31;15(1):88. doi: 10.1186/s13073-023-01248-6. Genome Med. 2023. PMID: 37904203 Free PMC article.
-
Behavioral sensitization induced by methamphetamine causes differential alterations in gene expression and histone acetylation of the prefrontal cortex in rats.BMC Neurosci. 2021 Apr 6;22(1):24. doi: 10.1186/s12868-021-00616-5. BMC Neurosci. 2021. PMID: 33823794 Free PMC article.
References
-
- Alzheimer’s Association (2014) 2014 Alzheimer’s disease facts and figures. Alzheimers Dement 10, e47–e92. - PubMed
-
- Andrieu S, Coley N, Lovestone S, Aisen PS, Vellas B (2015) Prevention of sporadic Alzheimer’s disease: Lessons learned from clinical trials and future directions. Lancet Neurol 14, 926–944. - PubMed
-
- Mullane K, Williams M (2013) Alzheimer’s therapeutics: Continued clinical failures question the validity of the amyloid hypothesis-but what lies beyond? Biochem Pharmacol 85, 289–305. - PubMed
-
- Rinne JO, Brooks DJ, Rossor MN, Fox NC, Bullock R, Klunk WE, Mathis CA, Blennow K, Barakos J, Okello AA, Rodriguez Martinez deLiano S, Liu E, Koller M, Gregg KM, Schenk D, Black R, Grundman M (2010) 11C-PiB PET assessment of change in fibrillar amyloid-betaload in patients with Alzheimer’s disease treated withbapineuzumab: A phase 2, double-blind, placebo-controlled,ascending-dose study. Lancet Neurol 9, 363–372. - PubMed
MeSH terms
Substances
LinkOut - more resources
Full Text Sources
Other Literature Sources
Medical
Research Materials
Miscellaneous
