

The impact of climate change and emissions control on future ozone levels: Implications for human health
- PMID: 28800413
- PMCID: PMC8166453
- DOI: 10.1016/j.envint.2017.08.001
The impact of climate change and emissions control on future ozone levels: Implications for human health
Abstract
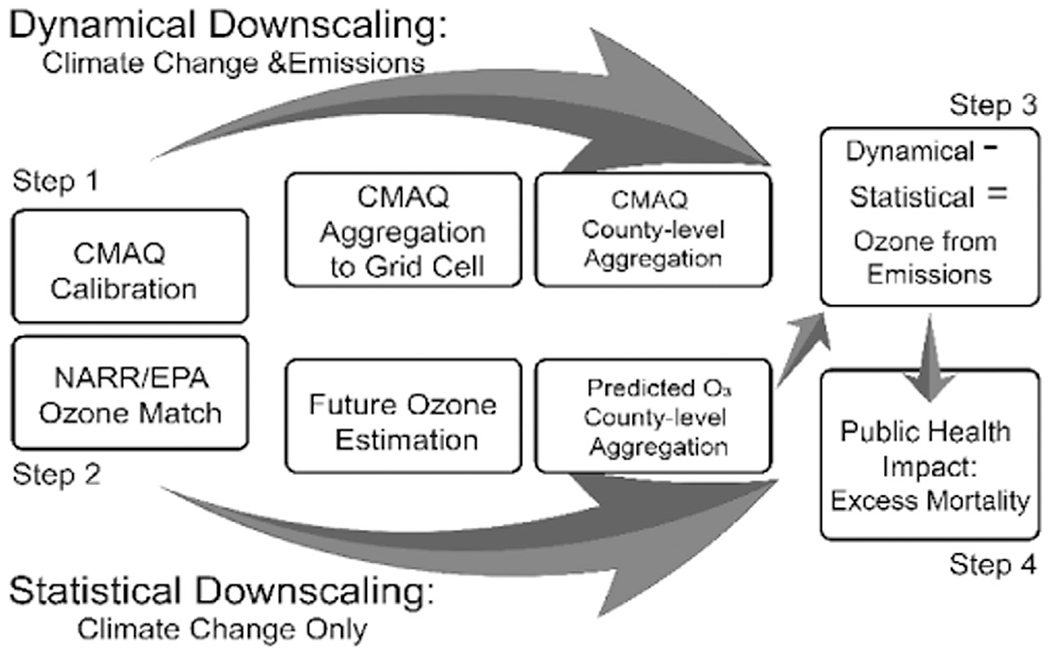
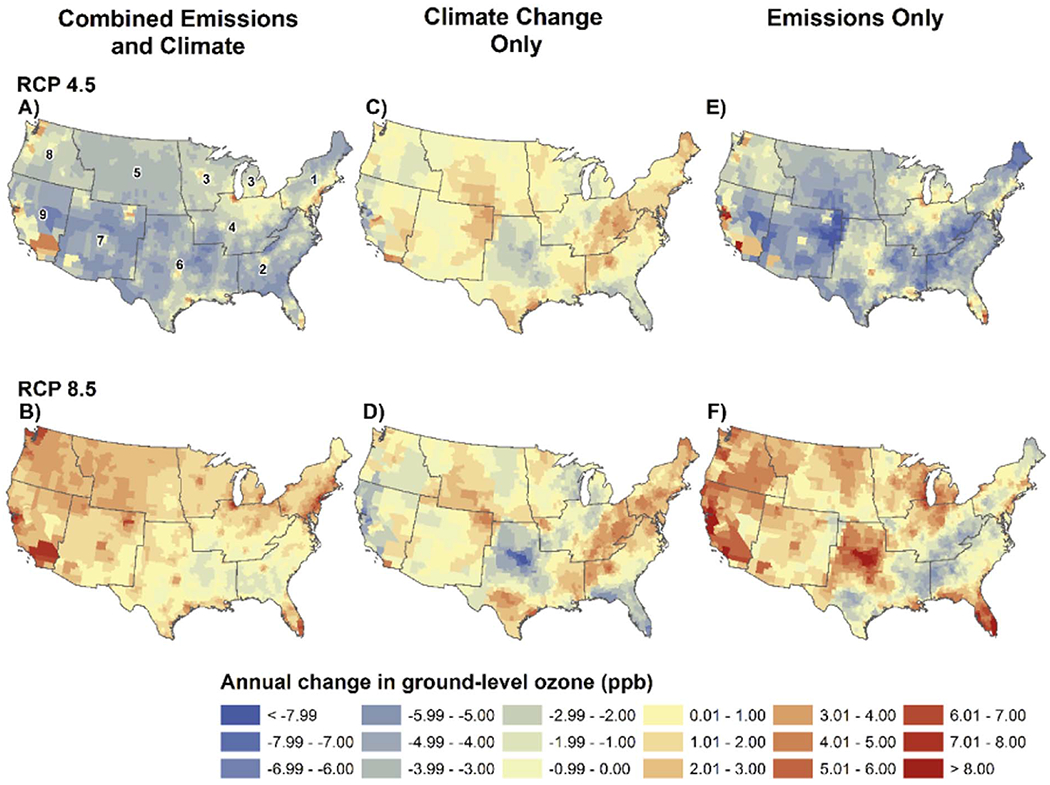
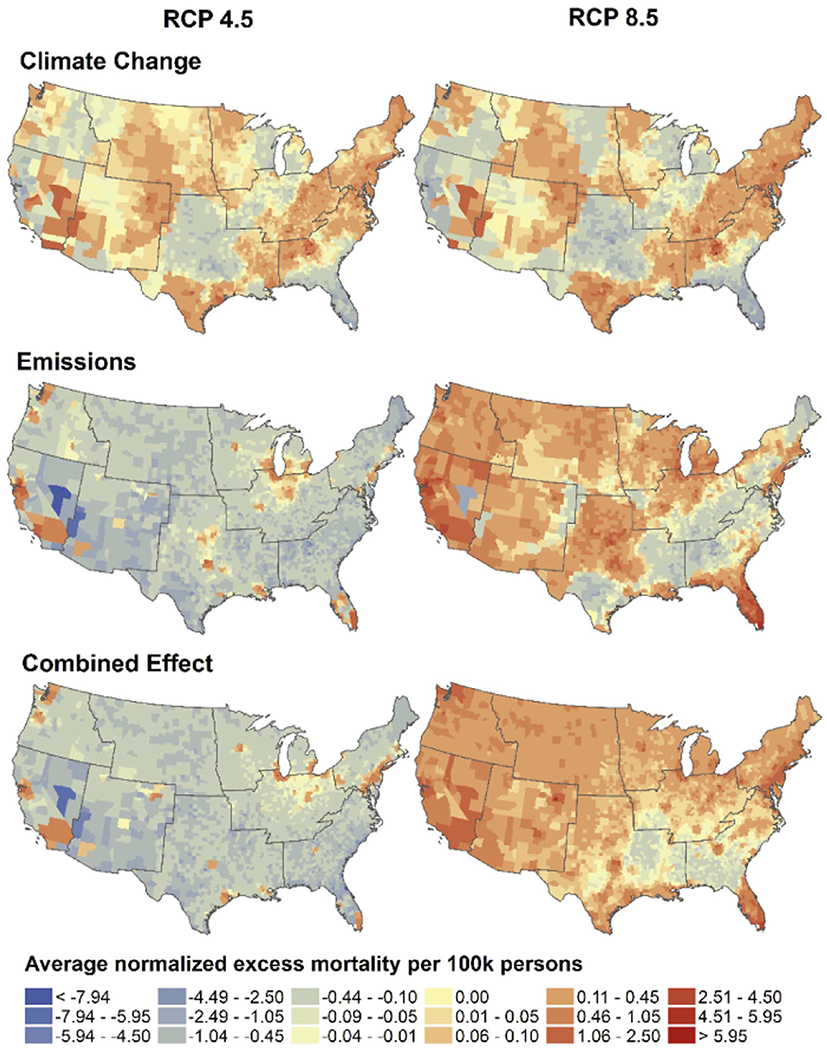
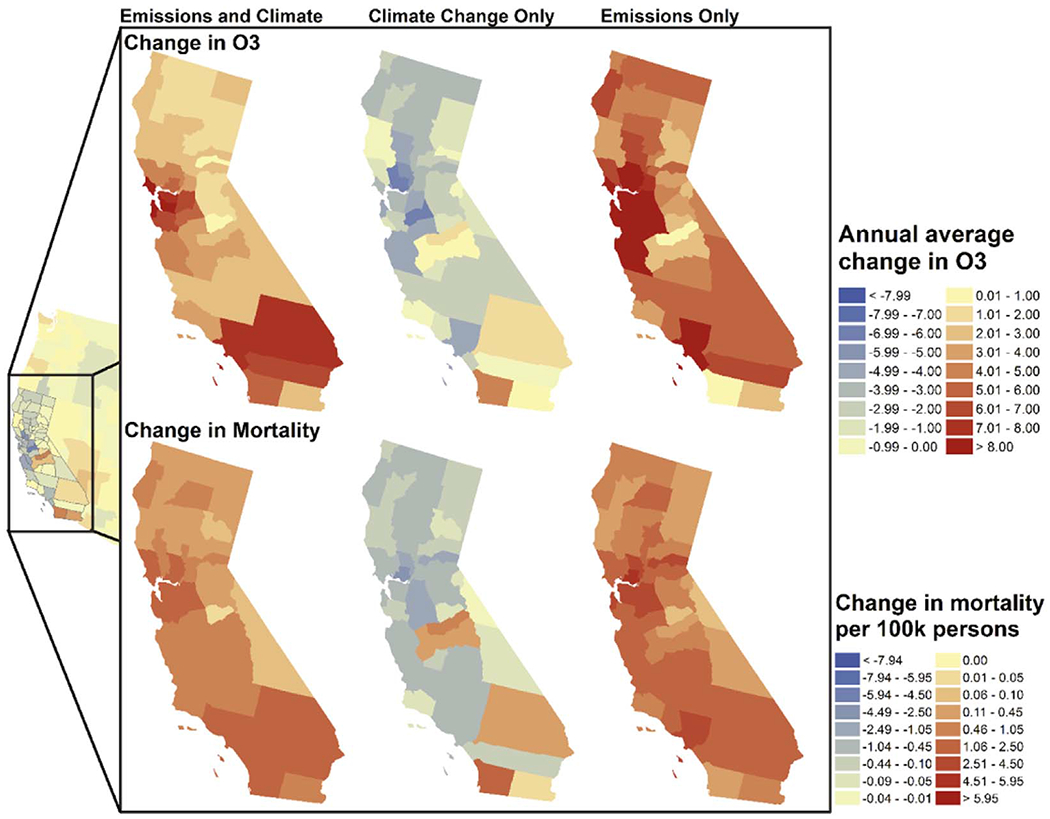
Overwhelming evidence has shown that, from the Industrial Revolution to the present, human activities influence ground-level ozone (O3) concentrations. Past studies demonstrate links between O3 exposure and health. However, knowledge gaps remain in our understanding concerning the impacts of climate change mitigation policies on O3 concentrations and health. Using a hybrid downscaling approach, we evaluated the separate impact of climate change and emission control policies on O3 levels and associated excess mortality in the US in the 2050s under two Representative Concentration Pathways (RCPs). We show that, by the 2050s, under RCP4.5, increased O3 levels due to combined climate change and emission control policies, could contribute to an increase of approximately 50 premature deaths annually nationwide in the US. The biggest impact, however, is seen under RCP8.5, where rises in O3 concentrations are expected to result in over 2,200 additional premature deaths annually. The largest increases in O3 are seen in RCP8.5 in the Northeast, the Southeast, the Central, and the West regions of the US. Additionally, when O3 increases are examined by climate change and emissions contributions separately, the benefits of emissions mitigation efforts may significantly outweigh the effects of climate change mitigation policies on O3-related mortality.
Keywords: Climate change; Emissions; Mortality; Ozone; Pollution; Predictive modeling; Public health.
Copyright © 2017 Elsevier Ltd. All rights reserved.
Conflict of interest statement
Conflicts of interest
The authors of this manuscript have no competing associations or conflicts of interest pertaining to this study.
Figures
References
-
- Agency, U. S. E. P., 2017. Updates to the Demographic and Spatial Allocation Models to Produce Integrated Climate and Land Use Scenarios (ICLUS) (Final Report, Version 2). Washington, D.C. .
-
- ALA, 2015. A. L. A. State of the Air 2015. American Lung Association, Chicago, IL.
-
- Bell ML, et al. , 2007. Climate change, ambient ozone, and health in 50 US cities. Clim. Chang. 82, 61–76. 10.1007/s10584-006-9166-7. - DOI
MeSH terms
Substances
Grants and funding
LinkOut - more resources
Full Text Sources
Other Literature Sources
Medical
Miscellaneous
