. 2017 Nov;174(21):3795-3810.
doi: 10.1111/bph.13975. Epub 2017 Sep 20.

Levothyroxine enhances glucose clearance and blunts the onset of experimental type 1 diabetes mellitus in mice

Affiliations

Levothyroxine enhances glucose clearance and blunts the onset of experimental type 1 diabetes mellitus in mice

Livia López-Noriega et al. Br J Pharmacol. 2017 Nov.

Abstract

Background and purpose: Thyroid hormones induce several changes in whole body metabolism that are known to improve metabolic homeostasis. However, adverse side effects have prevented its use in the clinic. In view of the promising effects of thyroid hormones, we investigated the effects of levothyroxine supplementation on glucose homeostasis.

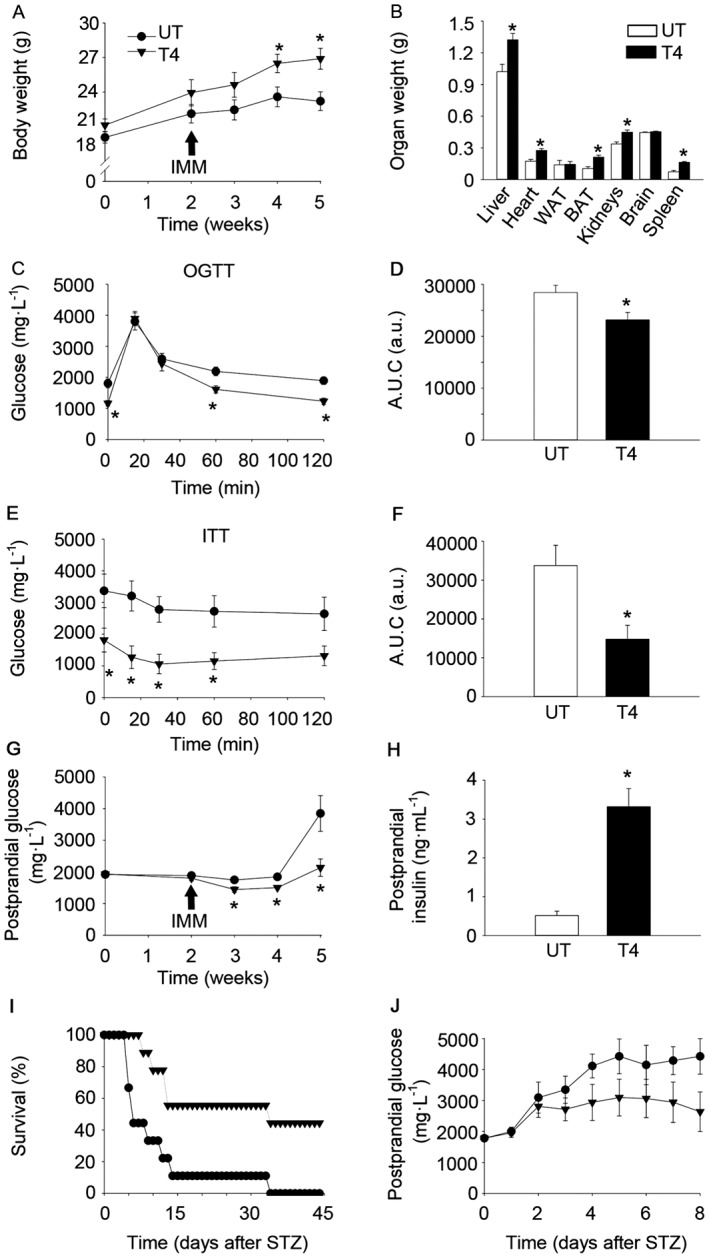
Experimental approach: C57BL/6 mice were treated with levothyroxine from birth to 24 weeks of age, when mice were killed. The effects of levothyroxine supplementation on metabolic health were determined. C57BL/6 mice treated with levothyroxine for 2 weeks and then challenged with streptozotocin to monitor survival. Mechanistic experiments were conducted in the pancreas, liver and skeletal muscle. RIP-B7.1 mice were treated with levothyroxine for 2 weeks and were subsequently immunized to trigger experimental autoimmune diabetes (EAD). Metabolic tests were performed. Mice were killed and metabolic tissues were extracted for immunohistological analyses.

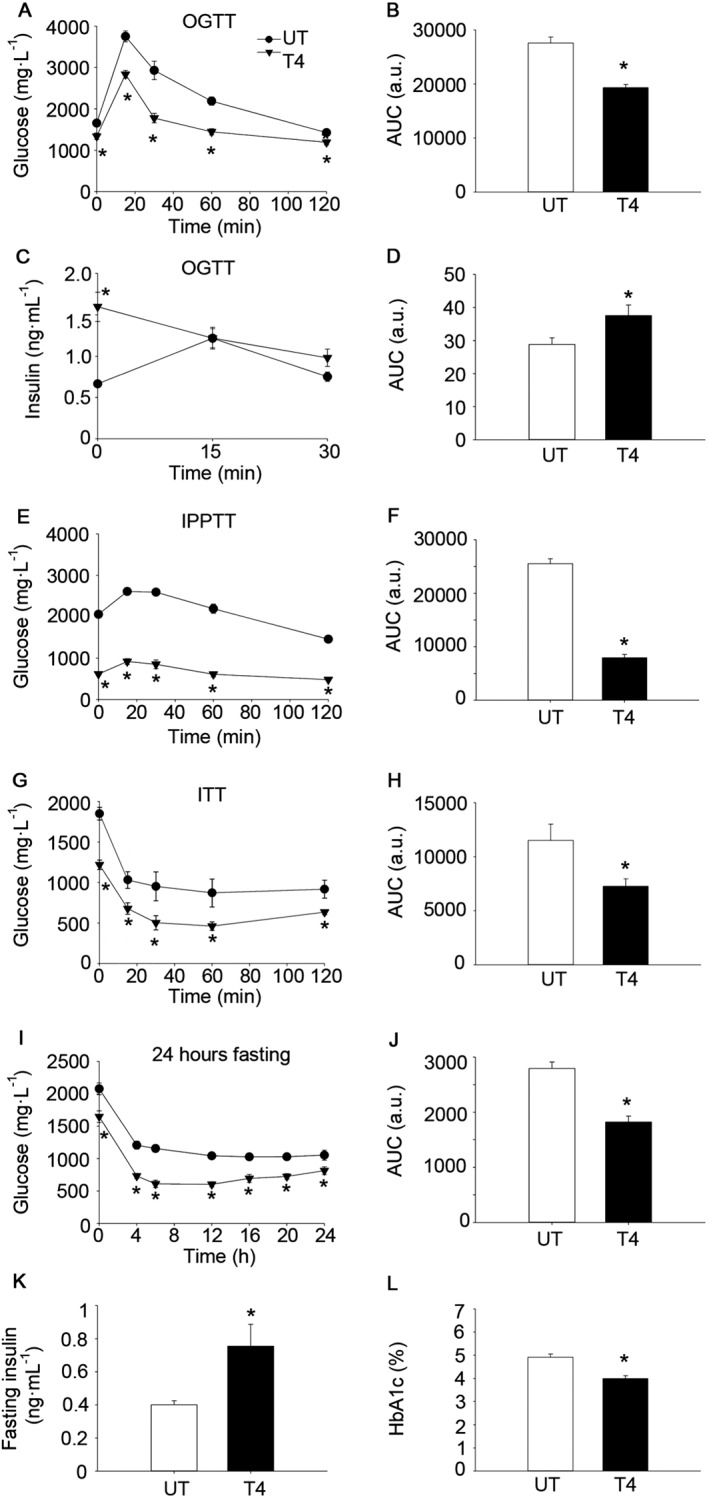
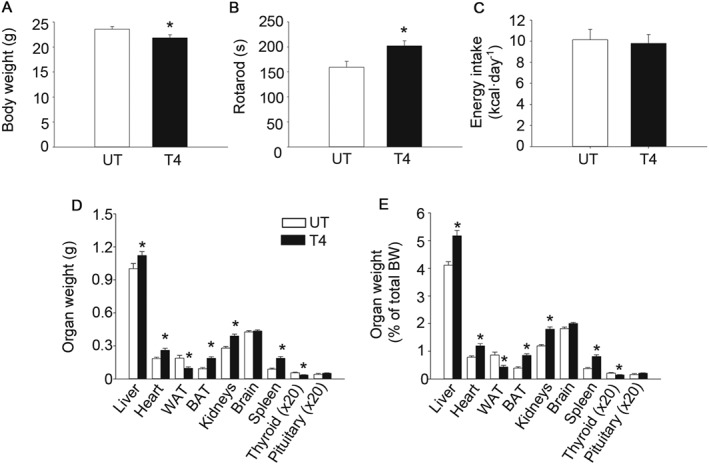
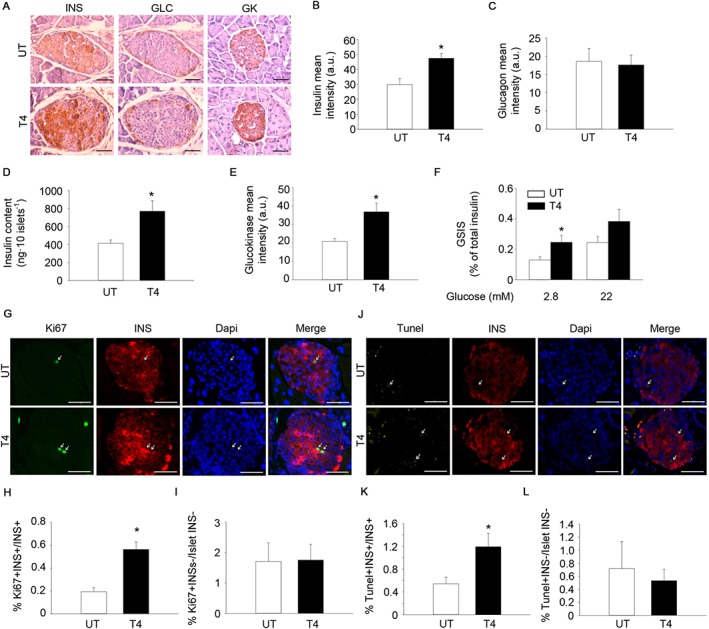
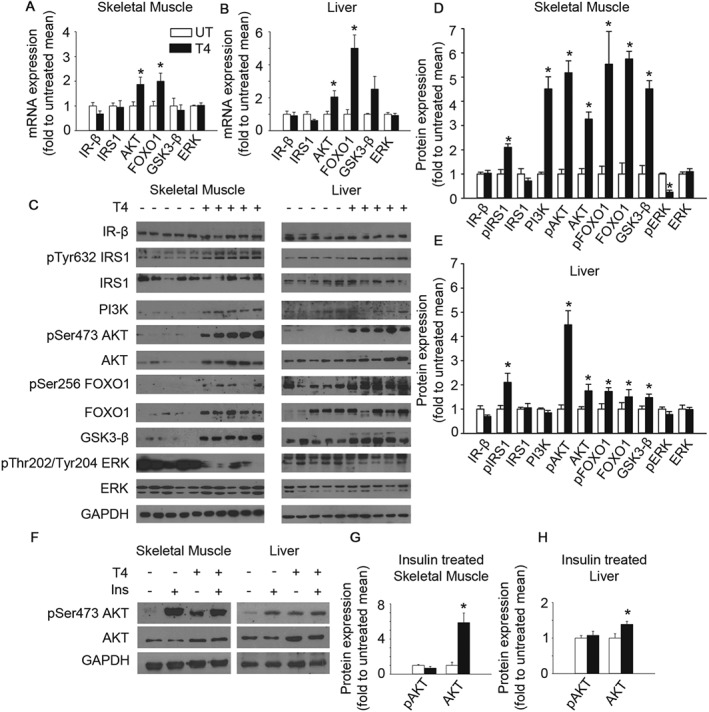
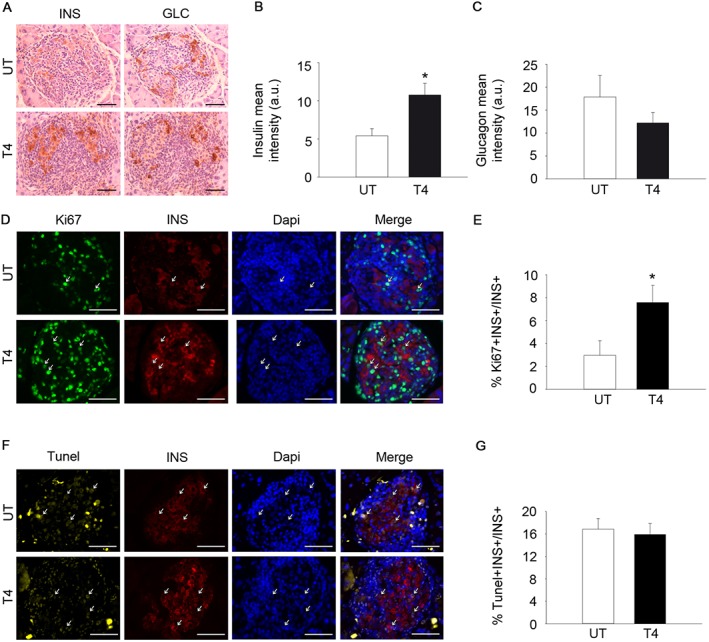
Key results: Long-term levothyroxine supplementation enhanced glucose clearance and reduced circulating glucose in C57BL/6 mice. Levothyroxine increased simultaneously the proliferation and apoptosis of pancreatic beta cells, promoting the maintenance of a highly insulin-expressing beta cell population. Levothyroxine increased circulating insulin levels, inducing sustained activation of IRS1-AKT signalling in insulin-target tissues. Levothyroxine-treated C57BL/6 mice challenged with streptozotocin exhibited extended survival. Levothyroxine blunted the onset of EAD in RIP-B7.1 mice by inducing beta cell proliferation and preservation of insulin-expressing cells.

Conclusions and implications: Interventions based on the use of thyroid hormones or thyromimetics could be explored to provide therapeutic benefit in patients with type 1 diabetes mellitus.


Figures

Figure 1
Figure 1
T4 enhances glucose clearance in wild‐type C57BL/6 mice. (A) Glucose concentration in blood after oral glucose load (OGTT). Age = 10 weeks. n = 13 per group. (B) AUC of glucose levels during the OGTT. (C) Plasma levels of insulin after oral glucose load (OGTT). Age = 9 weeks. n = 7 untreated; n = 8 T4‐treated. (D) AUC of insulin levels during OGTT curve. (E) Glucose concentration in blood after intraperitoneal pyruvate load (IPPTT). Age = 8 weeks. n = 7 untreated; n = 8 T4‐treated. (F) AUC of glucose levels during the IPPTT. (G) Glucose concentration in blood after i.p. insulin injection (ITT). Age = 11 weeks. n = 12 untreated; n = 13 T4‐treated. (H) AUC of glucose levels during the ITT. (I) Glucose concentration in blood during a 24 h fasting period. Age = 12 weeks. n = 7 untreated; n = 8 T4‐treated. (J) AUC of glucose levels during the 24 h fasting period. (K) Sixteen‐hour fasting circulating insulin levels. Age = 12 weeks. n = 7 untreated; n = 8 T4‐treated. (L) Percentage of glycated haemoglobin (HbA1c) in blood. Age = 23 weeks. n = 9 untreated; n = 14 T4‐treated. UT, untreated; T4, T4‐treated. Data shown are the means ± SEM. *P < 0.05, significantly different from untreated mice; two tailed Student's t‐test.
Figure 2
Figure 2
T4 reduces body weight and increases rotarod performance. (A) Body weight. Age = 24 weeks. n = 12 untreated; n = 18 T4‐treated. (B) Time to fall from an accelerating rotarod. Age = 21 weeks. n = 12 untreated; n = 18 T4‐treated. (C) Energy intake. Age = 8 weeks. n = 7 untreated; n = 8 T4‐treated. (D) Organs weight. Age = 24 weeks. For liver, heart, WAT, BAT, kidney, brain and spleen n = 12 untreated; n = 18 T4‐treated. For thyroid and pituitary n = 6 untreated; n = 7 T4‐treated. (E) Organs weight divided by body weight. Age = 24 weeks. For liver, heart, WAT, BAT, kidney, brain and spleen n = 12 untreated; n = 18 T4‐treated. For thyroid and pituitary n = 6 untreated; n = 7. UT, untreated; T4, T4‐treated. Data shown are the means ± SEM. *P < 0.05, significantly different from untreated mice; two tailed Student's t‐test.
Figure 3
Figure 3
T4 increases insulin expression and enhances the proliferation of pancreatic beta cells. (A) Representative images of insulin (INS), glucagon (GLC) and glucokinase (GK) staining in pancreas from mice treated or not with T4. Diaminobenzidine staining followed by haematoxylin counterstaining. Scale bar = 50 μm. INS; n = 5 per group. GLC; n = 5 per group. GK; n = 6 per group. (B) Quantification of insulin staining (mean intensity). (C) Quantification of glucagon staining (mean intensity). (D) Determination of pancreatic islet insulin content by elisa. n = 6 untreated, n = 7 T4‐treated. (E) Quantification of glucokinase staining (mean intensity). (F) Determination of GSIS. n = 6 untreated, n = 7 T4‐treated. (G) Representative images of Ki67 and insulin staining in pancreases from mice treated or not with T4. Immunofluorescence followed by DAPI staining. Scale bar, 50 μm. n = 5 per group. (H) Percentage of Ki67+‐Insulin+ cells over total insulin+ cells. (I) Percentage of Ki67+‐Insulin cells over total insulin cells residing in pancreatic islets. (J) Representative images of TUNEL and insulin staining in pancreas from mice treated or not with T4. Immunofluorescence followed by DAPI staining. Scale bar = 50 μm. n = 5 per group. (K) Percentage of TUNEL+‐Insulin+ cells over total insulin+ cells. (L) Percentage of TUNEL+‐Insulin cells over total insulin cells residing in pancreatic islets. UT, untreated; T4, T4‐treated. Arrows indicate representative positive staining. Data shown are the means ± SEM. *P < 0.05 significantly different from untreated mice; two tailed Student's t‐test.
Figure 4
Figure 4
T4 activates insulin signalling in skeletal muscle and liver. (A) Determination of mRNA levels of several members of the insulin pathway in the skeletal muscle of mice treated or not with T4. Mice were fasted for 16 h before they were killed. Values were normalized to untreated mice. IR‐β; n = 5. IRS1; n = 6. Akt; n = 5. FOXO1; n = 6. GSK3‐β; n = 6. ERK; n = 6. (B) Determination of mRNA levels of several members of the insulin pathway in the liver of mice treated or not with T4. Mice were fasted for 16 h before they were killed. Values were normalized to untreated mice. IR‐β; n = 6 untreated, n = 5 T4‐treated. IRS1; n = 6 untreated, n = 5 T4‐treated. AKT; n = 6. FOXO1; n = 6 untreated, n = 5 T4‐treated. GSK3‐β; n = 5. ERK; n = 6 untreated, n = 5 T4‐treated. (C) Western blots indicating activation of insulin signalling in the skeletal muscle and the liver of T4‐treated mice. Mice were fasted for 16 h before they were killed. n = 5 per group. (D) Densitometric analysis of the Western blots using skeletal muscle extracts shown in panel C. Values were normalized to untreated mice. (E) Densitometric analysis of the Western blots using liver extracts shown in panel C. Values were normalized to untreated mice. (F) Representative images of Western blots showing the maximal activation of insulin signalling in T4‐treated and untreated mice challenged with an insulin injection (0.75 U·kg−1 of body weight) 15 min prior euthanization. Mice were fasted for 16 h before they were killed. (G) Densitometric analysis of the Western blots using skeletal muscle extracts shown in Supporting Information Figure S4A. n = 5 untreated, n = 6 T4‐treated. Values were normalized to untreated mice. (H) Densitometric analysis of the Western blots using liver extracts shown in Supporting Information Figure S4A. n = 5 untreated, n = 6 T4‐treated. Values were normalized to untreated mice. UT, untreated; T4, T4‐treated. Data shown are the means ± SEM. *P < 0.05, significantly different from untreated mice; two tailed Student's t‐test.
Figure 5
Figure 5
T4 blunts the onset of T1DM in the RIP‐B7.1 model of EAD and increases survival in STZ‐challenged C57BL/6 mice. (A) Body weight of RIP‐B7.1 mice. n = 8 untreated; n = 9 T4‐treated. (B) Organs weight of RIP‐B7.1 mice. n = 6 untreated; n = 9 T4‐treated. (C) Glucose concentration in blood during an OGTT at 4 weeks of T4‐treatment of RIP‐B7.1 mice. n = 8 untreated; n = 9 T4‐treated. (D) AUC of glucose levels during the OGTT. (E) Glucose concentration in blood during and ITT at 5 weeks of T4‐treatment of RIP‐B7.1 mice. n = 7 untreated; n = 9 T4‐treated. (F) AUC of glucose levels during the ITT. (G) Postprandial glucose concentration in blood on RIP‐B7.1 mice. n = 8 untreated; n = 9 T4‐treated. (H) Circulating insulin levels in fed conditions. n = 7 untreated; n = 8 T4‐treated. (I) Survival of C57BL/6 mice challenged with STZ. n = 9 per group. (J) Postprandial glucose concentration in blood from C57BL/6 mice challenged with STZ. Alive animals were included (see Figure 5I for n in each time point). UT, untreated; T4, T4‐treated; IMM, immunization. Arrows indicate the time of immunization. Data shown are the means ± SEM *P < 0.05, significantly different from untreated mice; two tailed Student's t‐test. A LogRank survival test was applied to survival curves.
Figure 6
Figure 6
T4 increases insulin expression and enhances beta cell proliferation in the RIP‐B7.1 model of EAD. (A) Representative images of glucagon (GLC) and insulin (INS) staining in pancreases from immunized RIP‐B7.1 mice, with or without T4. Diaminobenzidine staining followed by haematoxylin counterstaining. Scale bar, 50 μm. n = 6 untreated; n = 5 T4‐treated. (B) Quantification of insulin staining (mean intensity). (C) Quantification of glucagon staining (mean intensity). (D) Representative images of Ki67 and insulin staining in pancreas from immunized RIP‐B7.1 mice, with or without T4. Immunofluorescence followed by DAPI staining. Scale bar = 50 μm. n = 5 untreated; n = 5 T4‐treated. (E) Percentage of Ki67+‐Insulin+ cells over total insulin+ cells. (F) Representative images of TUNEL and insulin staining in pancreases from immunized RIP‐B7.1 mice, with or without T4. Immunofluorescence followed by DAPI staining. Scale bar = 50 μm. n = 5 per group. (G) TUNEL Insulin+ cells, as % total insulin+ cells. UT, untreated; T4, T4‐treated. Arrows indicate representative positive staining. Data shown are the means ± SEM. *P < 0.05, significantly different from untreated mice; two tailed Student's t‐test.

References

    1. Aguayo‐Mazzucato C, Zavacki AM, Marinelarena A, Hollister‐Lock J, El Khattabi I, Marsili A et al (2013). Thyroid hormone promotes postnatal rat pancreatic beta‐cell development and glucose‐responsive insulin secretion through MAFA. Diabetes 62: 1569–1580. https://doi.org/10.2337/db12‐0849. - DOI - PMC - PubMed
    1. Aiello V, Moreno‐Asso A, Servitja JM, Martin M (2014). Thyroid hormones promote endocrine differentiation at expenses of exocrine tissue. Exp Cell Res 322: 236–248. https://doi.org/10.1016/j.yexcr.2014.01.030. - DOI - PubMed
    1. Alexander SPH, Cidlowski JA, Kelly E, Marrion N, Peters JA, Benson HE et al (2015a). The Concise Guide to PHARMACOLOGY 2015/16: Nuclear hormone receptors. Br J Pharmacol 172: 5956–5978. - PMC - PubMed
    1. Alexander SPH, Fabbro D, Kelly E, Marrion N, Peters JA, Benson HE et al (2015b). The Concise Guide to PHARMACOLOGY 2015/16: Enzymes. Br J Pharmacol 172: 6024–6109. - PMC - PubMed
    1. Bahn RS, Burch HB, Cooper DS, Garber JR, Greenlee MC, Klein I et al (2011). Hyperthyroidism and other causes of thyrotoxicosis: management guidelines of the American Thyroid Association and American Association of Clinical Endocrinologists. Endocr Pract 17: 456–520. https://doi.org/10.4158/EP.17.3.456. - DOI - PubMed